Fig. A.2
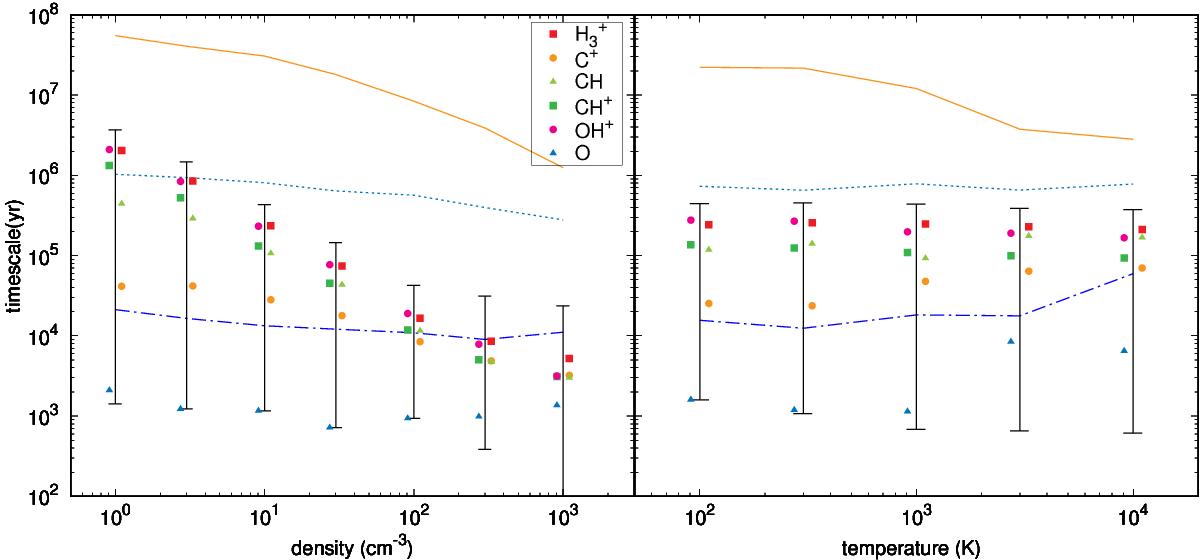
Timescales required by the species to reach their equilibrium abundances as a function of the density of the gas for a temperature fixed at 50 K (left panel) and as a function of the temperature of the gas for a density of 10 cm-3 (right). The H2 timescales (coloured curves) are computed in configuration (a) (see main text) for fsh,H2 = 104 (solid), 102 (dotted), and 1 (dot-dashed). Each curve results from an average of timescales computed for ten random initial conditions and two values of AV (0.1 and 1). The timescales of single molecules (coloured points) and the range of timescales of all other species (black segments) are computed in configuration (b) (see main text). These timescales are averaged over ten random initial conditions, two values of AV (0.1 and 1), and four values of f(H2) (10-3, 10-2, 10-1, and 1).
Current usage metrics show cumulative count of Article Views (full-text article views including HTML views, PDF and ePub downloads, according to the available data) and Abstracts Views on Vision4Press platform.
Data correspond to usage on the plateform after 2015. The current usage metrics is available 48-96 hours after online publication and is updated daily on week days.
Initial download of the metrics may take a while.