Fig. 7
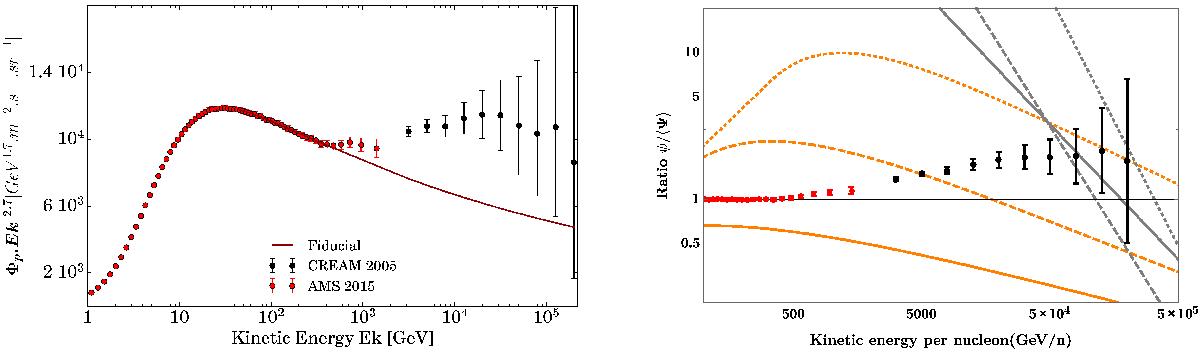
Left panel: proton flux from AMS02 (Aguilar et al. 2015) and CREAM (Yoon et al. 2011), and a fit of the spectrum between 45 GeV and 200 GeV that we assume here to be the mean Galactic flux. Right panel: data divided by the theoretical mean above 45 GeV, together with conditions ψc/ ⟨ Ψ ⟩ and ψmax/ ⟨ Ψ ⟩ of Fig. 2 (solid for MAX model, dashed for MED, and dotted for MIN).
Current usage metrics show cumulative count of Article Views (full-text article views including HTML views, PDF and ePub downloads, according to the available data) and Abstracts Views on Vision4Press platform.
Data correspond to usage on the plateform after 2015. The current usage metrics is available 48-96 hours after online publication and is updated daily on week days.
Initial download of the metrics may take a while.