Free Access
Fig. 6
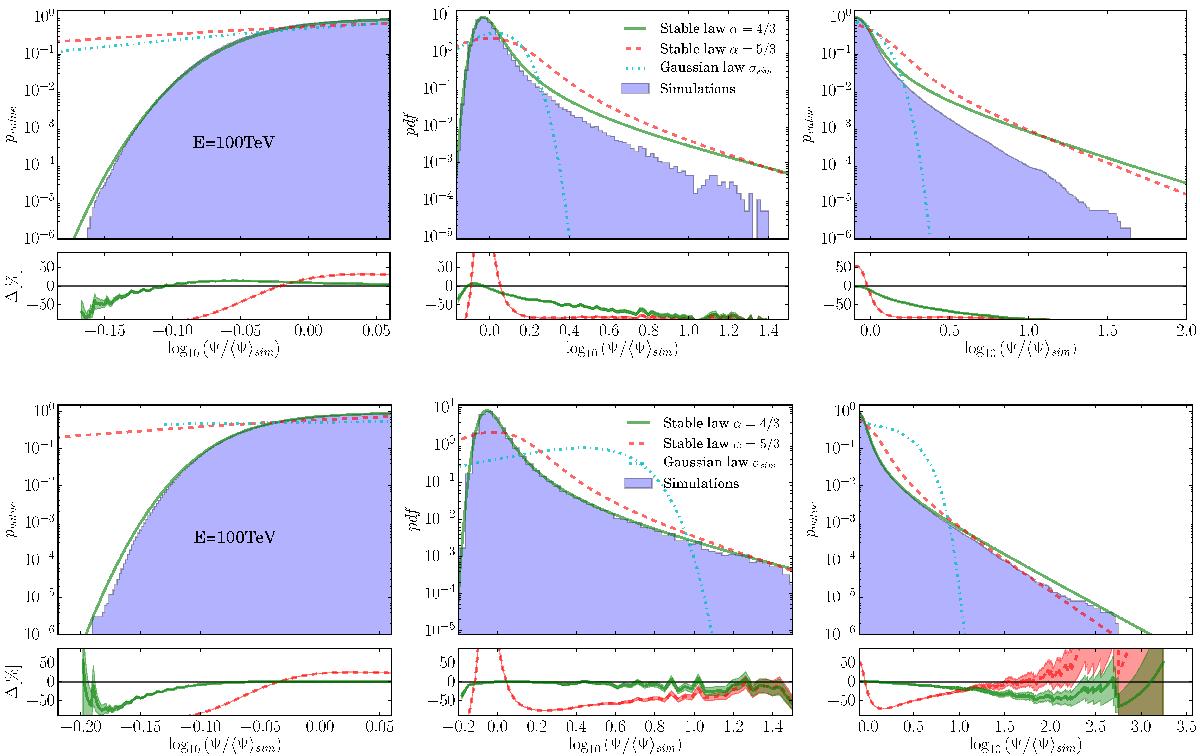
Same as in Fig 4 with a CR kinetic energy of 100 TeV. The upper row features the results of a simulation where the causality constraint is implemented whereas in the lower row, all sources are taken into account in the calculation of the flux Ψ, including those lying outside the light cone of the observer.
This figure is made of several images, please see below:
Current usage metrics show cumulative count of Article Views (full-text article views including HTML views, PDF and ePub downloads, according to the available data) and Abstracts Views on Vision4Press platform.
Data correspond to usage on the plateform after 2015. The current usage metrics is available 48-96 hours after online publication and is updated daily on week days.
Initial download of the metrics may take a while.