Fig. 5
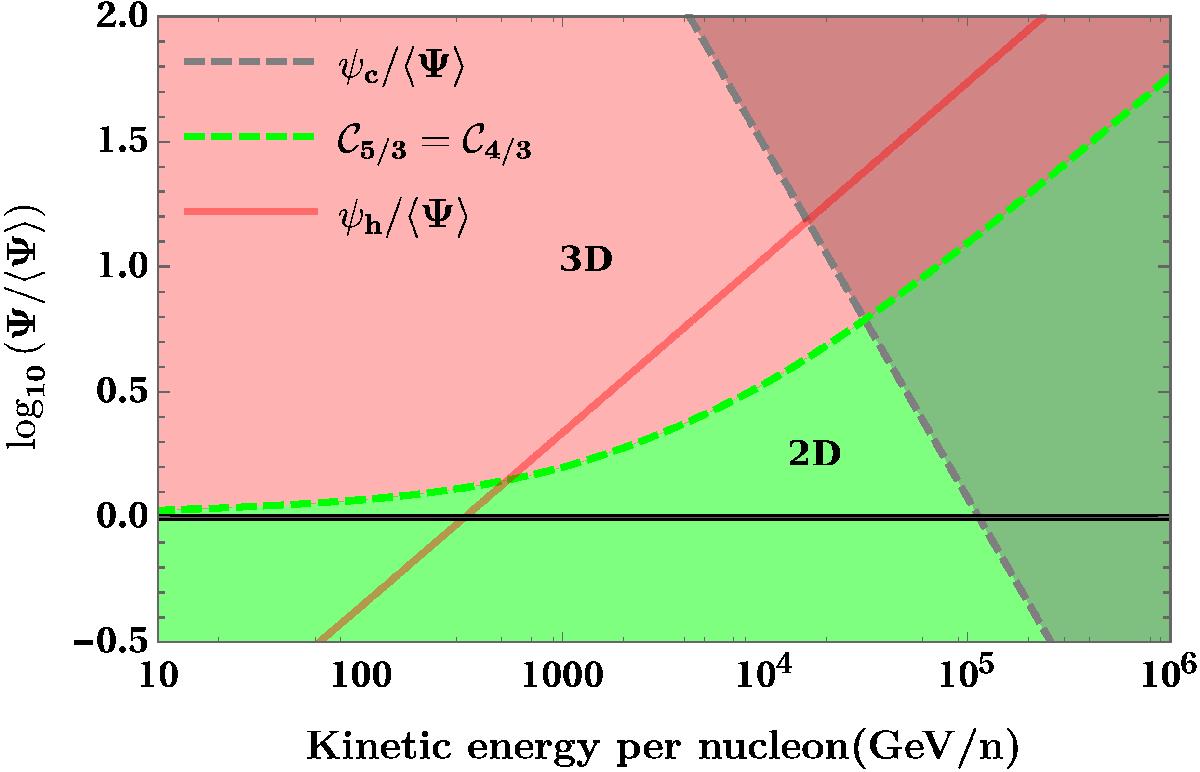
Regions in the flux versus energy plane where the 2D or 3D stable law is best suited to computing the probability of an excess above the mean (MED propagation model assumed). For a fluctuation lying in the light red (green) region, one should use the 3D (2D) approximation corresponding to the index α = 5/3 (α = 4/3). The dashed green curve signals the transition between these regimes as estimated from the equality of the cumulative distributions, ![]() . The solid red line reports the alternative estimate of ψh following the argument developed in the text. In the shaded area in the upper-right corner of the diagram, causality is expected to generate deviations from the stable law behavior as a result of the light cone cut-off ψc it implies on the pdf.
. The solid red line reports the alternative estimate of ψh following the argument developed in the text. In the shaded area in the upper-right corner of the diagram, causality is expected to generate deviations from the stable law behavior as a result of the light cone cut-off ψc it implies on the pdf.
Current usage metrics show cumulative count of Article Views (full-text article views including HTML views, PDF and ePub downloads, according to the available data) and Abstracts Views on Vision4Press platform.
Data correspond to usage on the plateform after 2015. The current usage metrics is available 48-96 hours after online publication and is updated daily on week days.
Initial download of the metrics may take a while.