Fig. 3
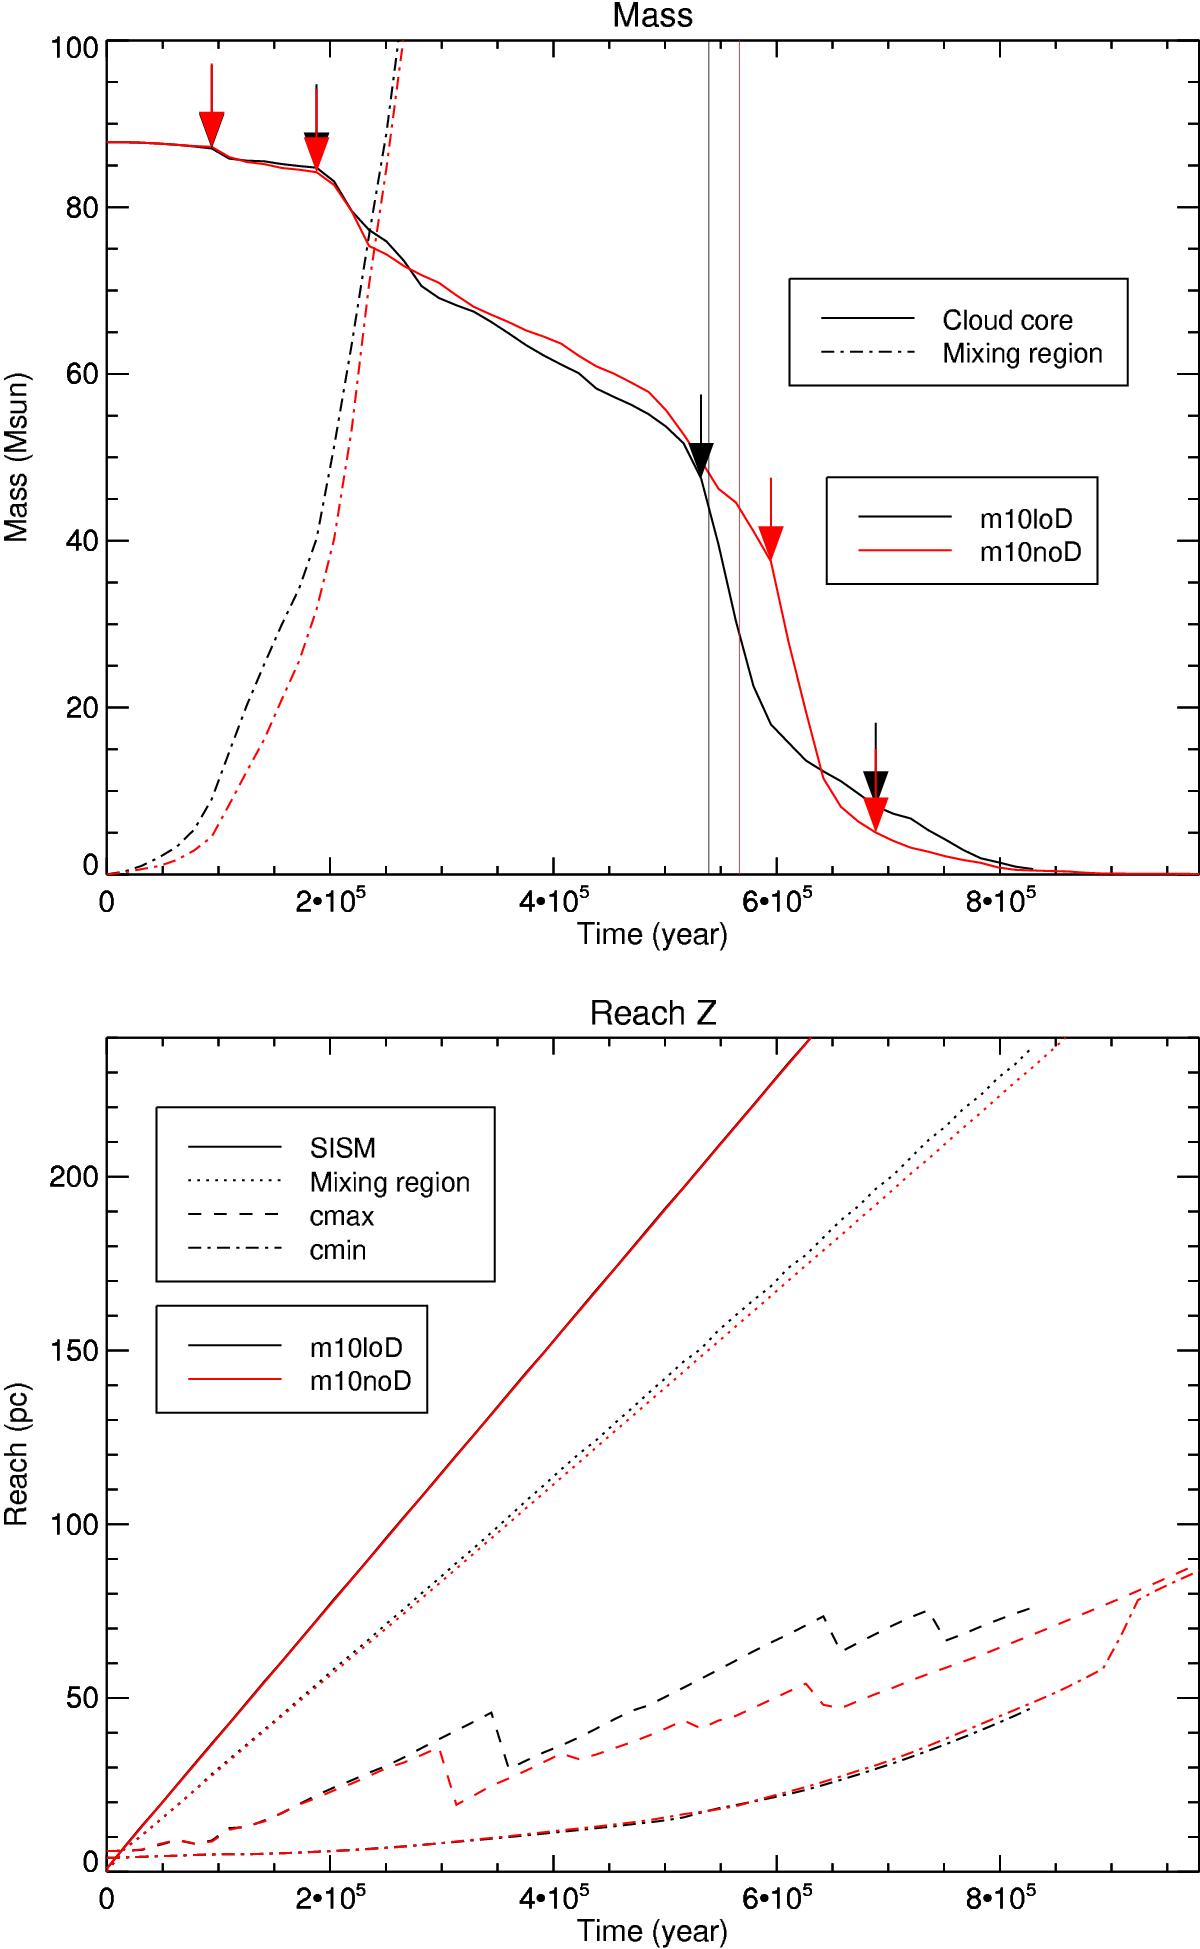
Comparing m10loD with m10noD. Top: evolution of the mass of the cloud core and the mixing region over time. The vertical line corresponds to tmix. The arrows represent the timesteps shown in Figs. 1 and 2. Bottom: evolution of the maximal Z reach of the shocked interstellar medium (SISM) and of the mixing region, together with both maximal and miminal cloud core position.
Current usage metrics show cumulative count of Article Views (full-text article views including HTML views, PDF and ePub downloads, according to the available data) and Abstracts Views on Vision4Press platform.
Data correspond to usage on the plateform after 2015. The current usage metrics is available 48-96 hours after online publication and is updated daily on week days.
Initial download of the metrics may take a while.