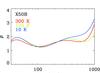
Fig. 3
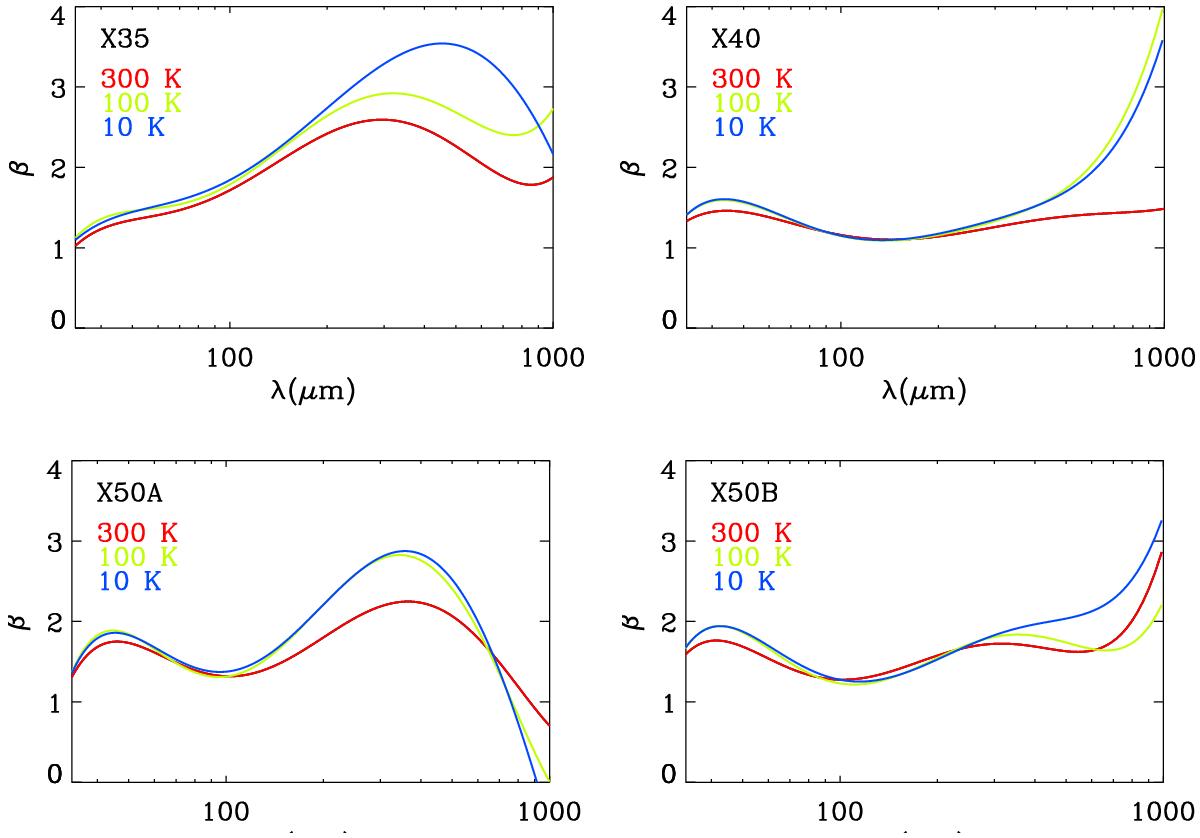
Spectral index as a function of the wavelength for the studied samples: X35 (upper left panel), X40 (upper right panel), X50A (lower left panel) and X50B (lower right panel). For each sample, the spectral index is displayed for different temperatures: 300 K (red), 100 K (green) ans 10 K (blue). The value of the spectral index was derived from a 6th order polynomial fit of the measured MAC.
Current usage metrics show cumulative count of Article Views (full-text article views including HTML views, PDF and ePub downloads, according to the available data) and Abstracts Views on Vision4Press platform.
Data correspond to usage on the plateform after 2015. The current usage metrics is available 48-96 hours after online publication and is updated daily on week days.
Initial download of the metrics may take a while.