Fig. A.2
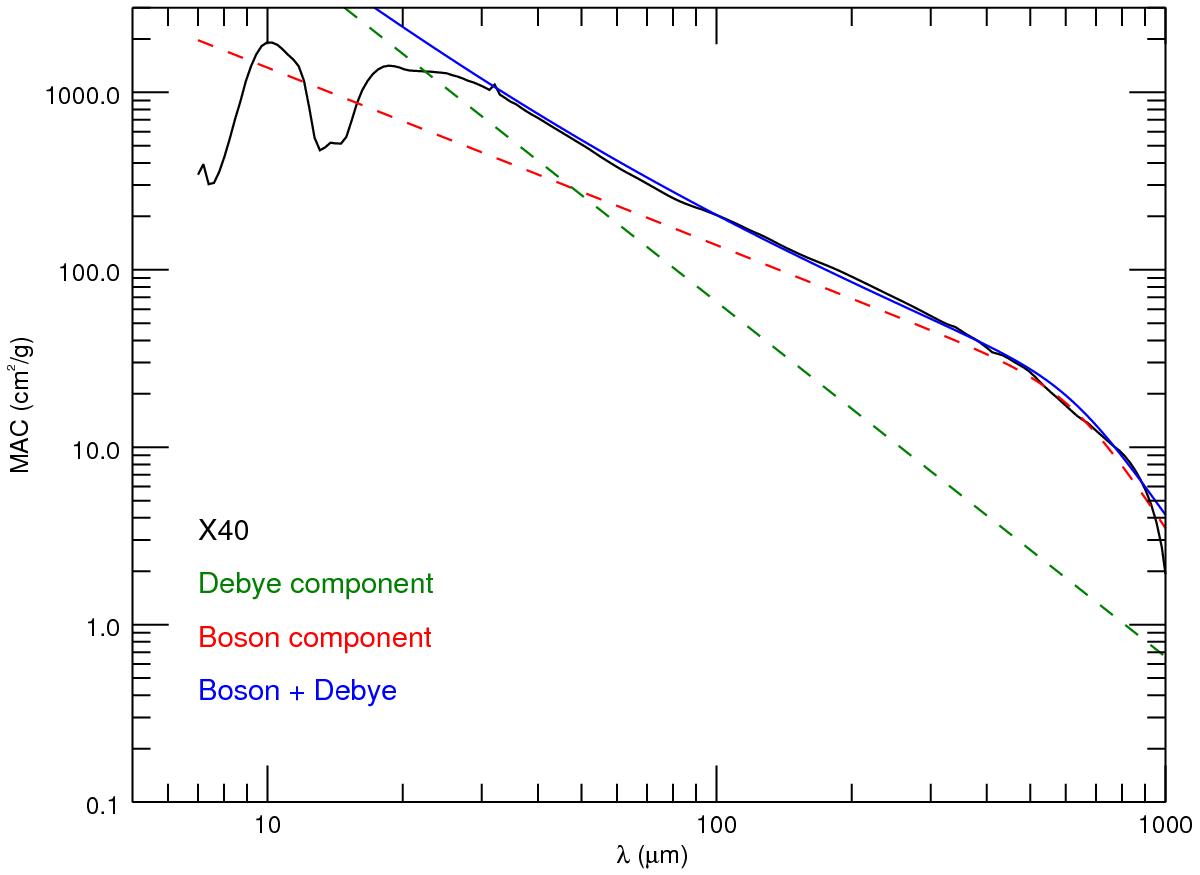
Modeling of the MAC of sample X40. The figure shows measured MAC (black line), the best model (blue line), the Debye component of the model (green dotted line) and the BP component of hte model (red dotted line).
Current usage metrics show cumulative count of Article Views (full-text article views including HTML views, PDF and ePub downloads, according to the available data) and Abstracts Views on Vision4Press platform.
Data correspond to usage on the plateform after 2015. The current usage metrics is available 48-96 hours after online publication and is updated daily on week days.
Initial download of the metrics may take a while.