Fig. 3
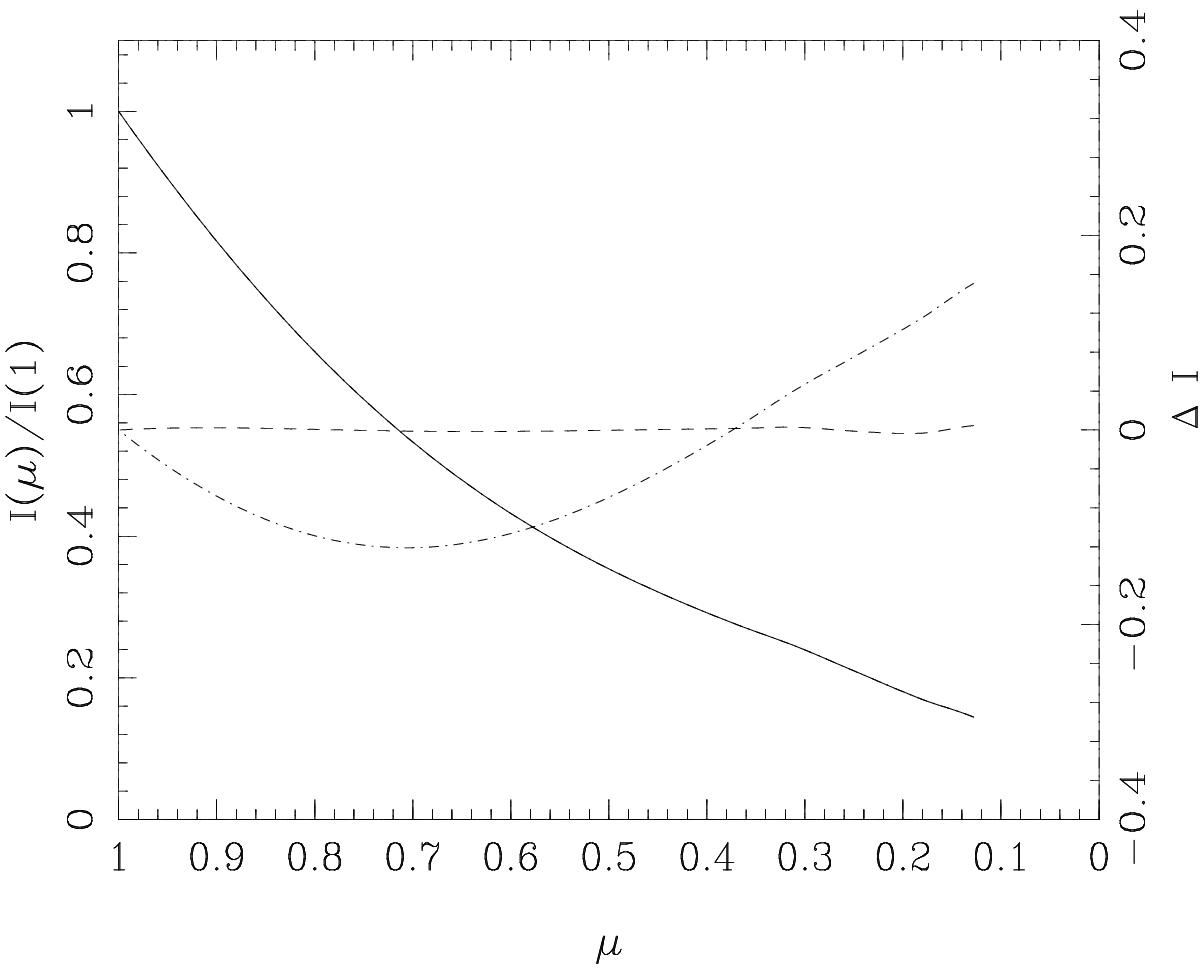
Specific intensity distribution for a [1500 K, 4.5] PHOENIX-DRIFT quasi-spherical symmetric model. Continuous line represents the model intensities (left label), while the dashed line denotes the deviations [model-fit] by adopting Eq. (5) and the dashed-dotted one represents the deviations by adopting Eq. (1) (right label): log[A/H] = 0.0, Vξ = 2 km s-1; TESS photometric system; LSM calculations.
Current usage metrics show cumulative count of Article Views (full-text article views including HTML views, PDF and ePub downloads, according to the available data) and Abstracts Views on Vision4Press platform.
Data correspond to usage on the plateform after 2015. The current usage metrics is available 48-96 hours after online publication and is updated daily on week days.
Initial download of the metrics may take a while.