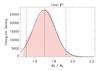
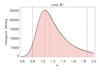
Fig. 6
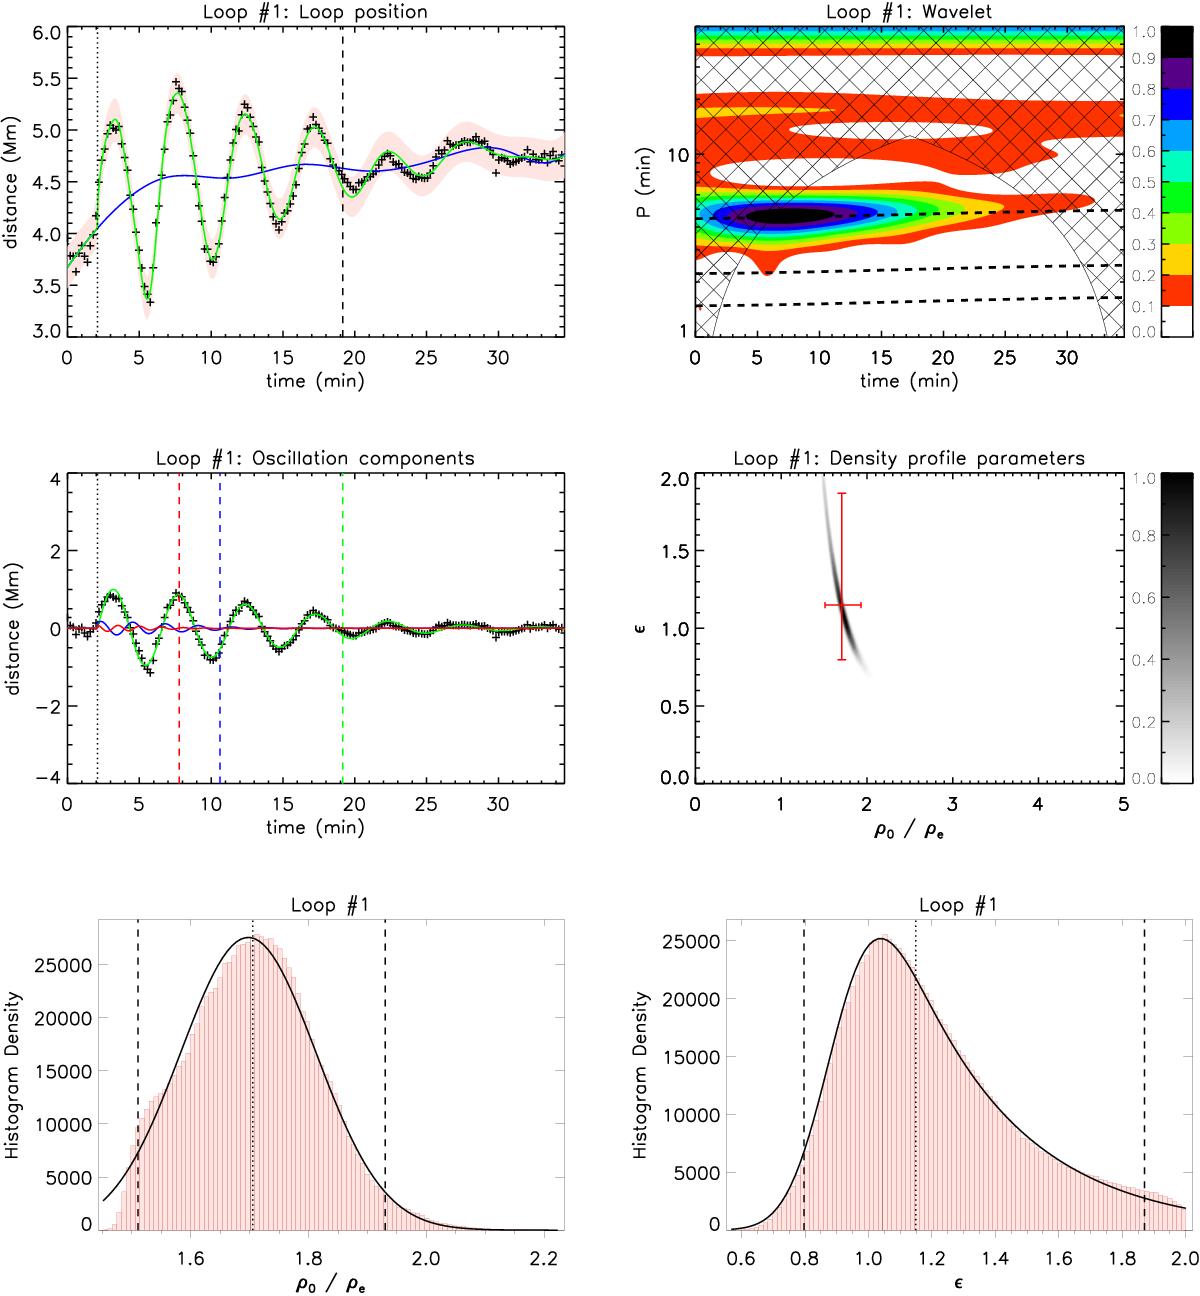
Analysis for Loop #1 using the dispersionless model. Top left: loop position (symbols) as a function of time is described by our model (green line) which includes a background trend (blue line) described by our spline procedure. The red shaded region represents the 99% credible intervals for the loop position predicted by the model, including an estimated noise σY. The dotted and dashed lines denote t0 and ts1, respectively. Top right: wavelet analysis of the loop position with colours representing the normalised spectral amplitude. The dashed lines show the time-dependent periods of oscillation described by our model. The hatched region denotes the cone of influence. Middle left: detrended loop position (symbols) with the first (green), second (blue), and third (red) longitudinal harmonics. Times ts1, ts2, and ts3 are denoted by the dashed lines in the corresponding colour. Middle right: density profile parameters determined by the oscillation damping envelope. The red bars are based on the median values and the 95% credible intervals, indicated by the dotted and dashed lines, respectively, in the histograms (bottom panels). The solid curves are fits to the histogram data using the exponentially modified Gaussian function.

Current usage metrics show cumulative count of Article Views (full-text article views including HTML views, PDF and ePub downloads, according to the available data) and Abstracts Views on Vision4Press platform.
Data correspond to usage on the plateform after 2015. The current usage metrics is available 48-96 hours after online publication and is updated daily on week days.
Initial download of the metrics may take a while.