Fig. 2
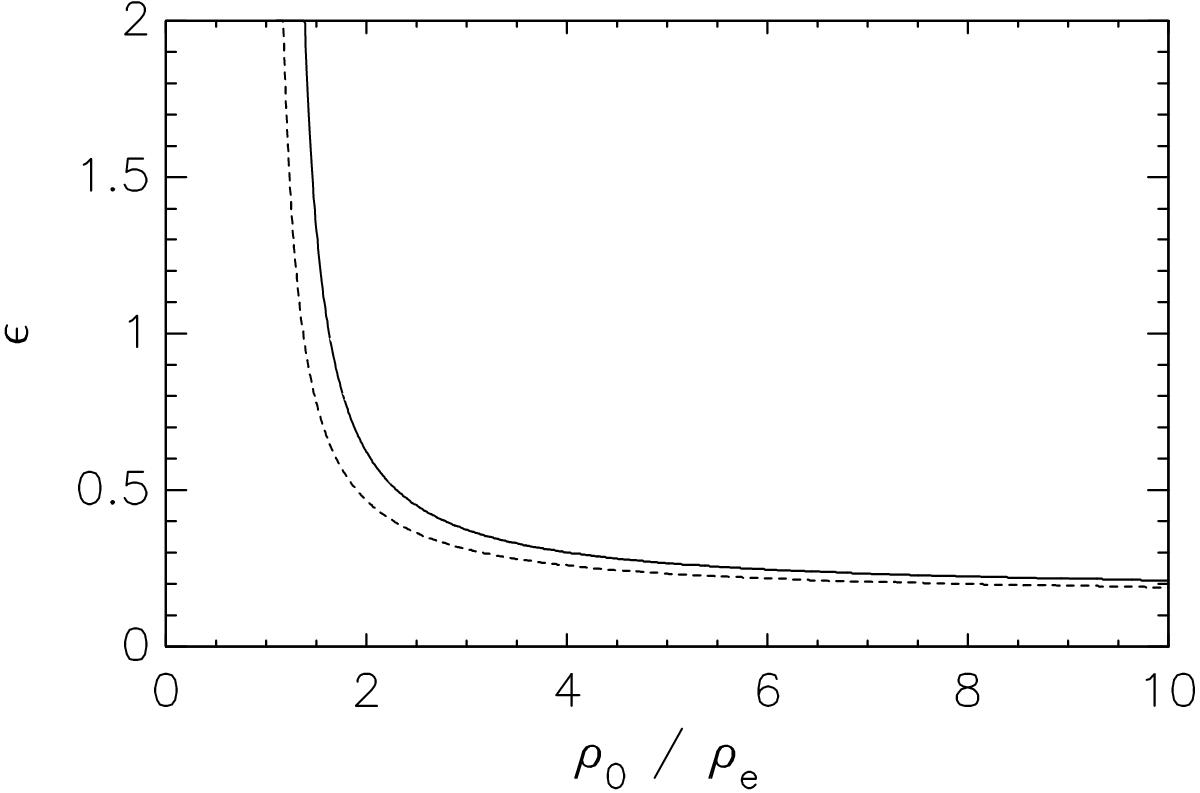
The inverse relationship between the density contrast ratio and the inhomogeneous layer width ϵ. The curves in parameter space correspond to the same kink oscillation damping rate due to mode coupling (Fig. 1 shows two particular density profiles). The solid curve corresponds to the damping rate calculated using the general damping profile (Eq. (1)) while the dashed curve is for the exponential damping regime alone.
Current usage metrics show cumulative count of Article Views (full-text article views including HTML views, PDF and ePub downloads, according to the available data) and Abstracts Views on Vision4Press platform.
Data correspond to usage on the plateform after 2015. The current usage metrics is available 48-96 hours after online publication and is updated daily on week days.
Initial download of the metrics may take a while.