Fig. 2
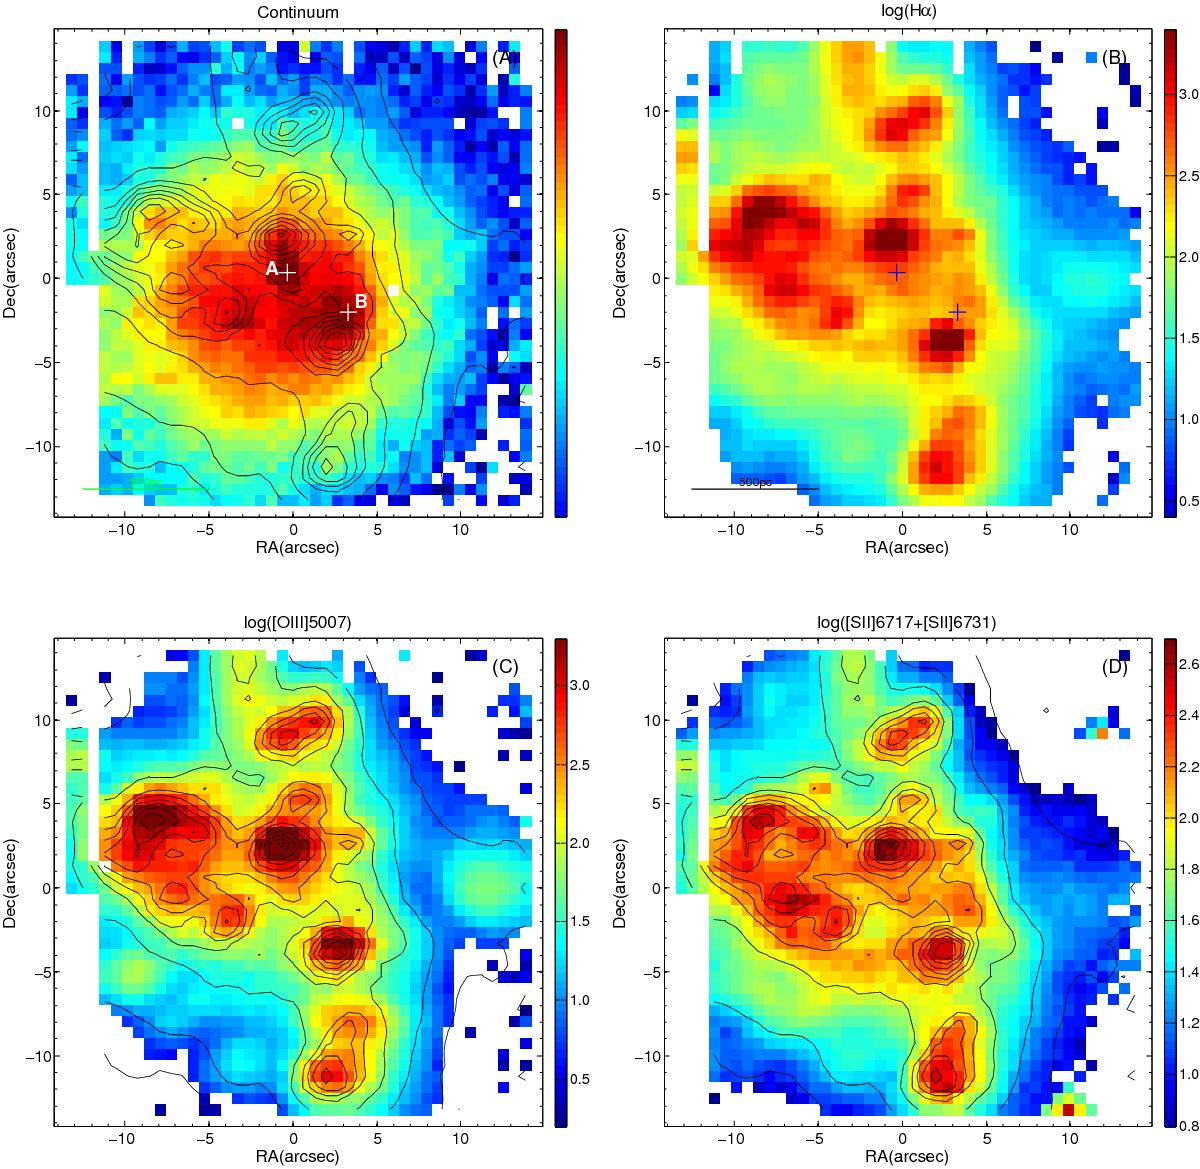
Panel A) Haro 14 intensity distribution in continuum with Hα contours overplotted; the map has been obtained by summing over the whole orange spectral range, but masking the emission lines. The two major continuum clusters are labeled a and b. The scale in parsec is indicated at the bottom left. The image is scaled in arbitrary flux units. Panel B) Hα emission-line flux (flux units are 10-18 erg s-1 cm-2). Panel C) [O iii] λ5007 emission-line flux with Hα contours overplotted. Panel D) [S ii] λλ 6717, 6731 emission-line flux with Hα contours overplotted.
Current usage metrics show cumulative count of Article Views (full-text article views including HTML views, PDF and ePub downloads, according to the available data) and Abstracts Views on Vision4Press platform.
Data correspond to usage on the plateform after 2015. The current usage metrics is available 48-96 hours after online publication and is updated daily on week days.
Initial download of the metrics may take a while.