Fig. 15
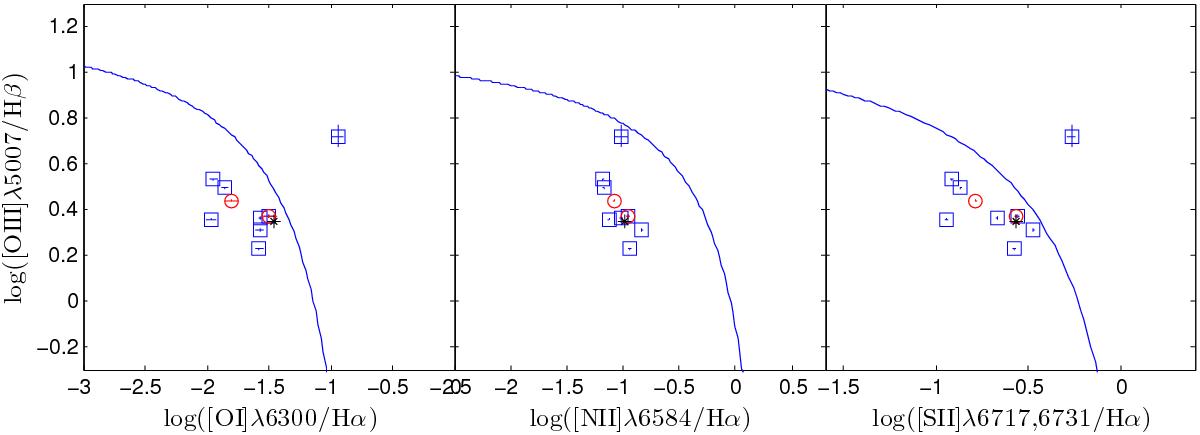
Optical emission-line diagnostic diagram for the individual regions identified in Haro 14, with the theoretical maximum starburst line (Kewley et al. 2001). Ratio values for the eight SF knots are shown as blue squares, for the two HSB stellar clusters as red circles, and for the integrated spectrum as a black star; errors are plotted as small crosses.
Current usage metrics show cumulative count of Article Views (full-text article views including HTML views, PDF and ePub downloads, according to the available data) and Abstracts Views on Vision4Press platform.
Data correspond to usage on the plateform after 2015. The current usage metrics is available 48-96 hours after online publication and is updated daily on week days.
Initial download of the metrics may take a while.