Free Access
Fig. 1
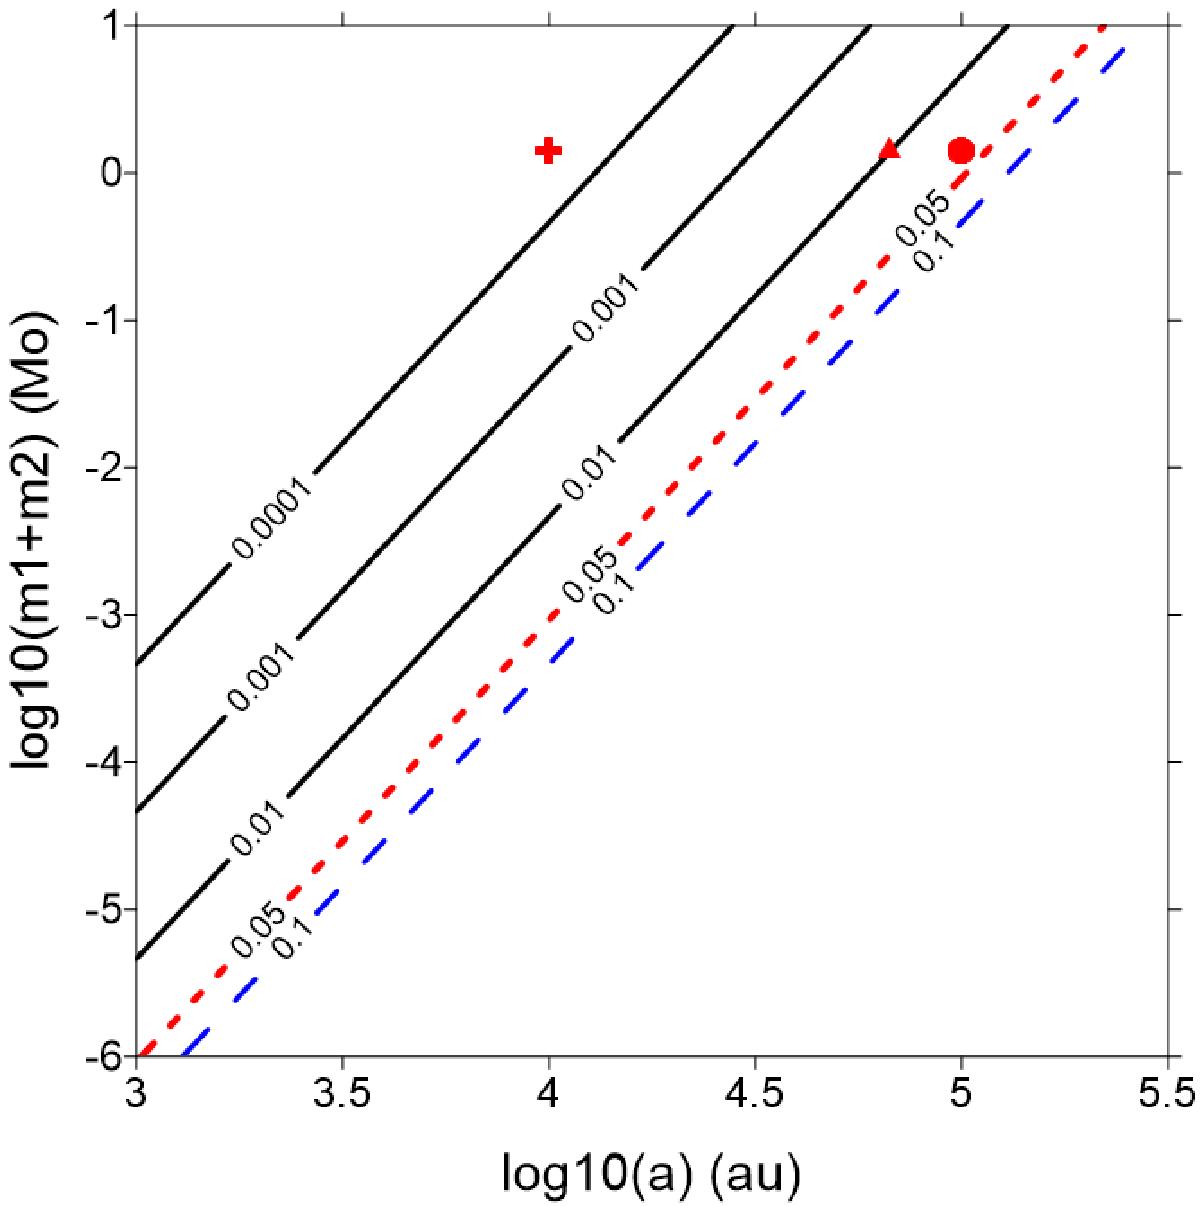
Level curves of constant ϵ in the plane (a, m1 + m2). The dotted red line indicates the limit for the integrable approximation. The approximation fails for the binary systems below the dashed blue line. The red symbols (cross, triangle, and circle) represent the position of three binary systems (see Sect. 2.5).
Current usage metrics show cumulative count of Article Views (full-text article views including HTML views, PDF and ePub downloads, according to the available data) and Abstracts Views on Vision4Press platform.
Data correspond to usage on the plateform after 2015. The current usage metrics is available 48-96 hours after online publication and is updated daily on week days.
Initial download of the metrics may take a while.