Fig. 9
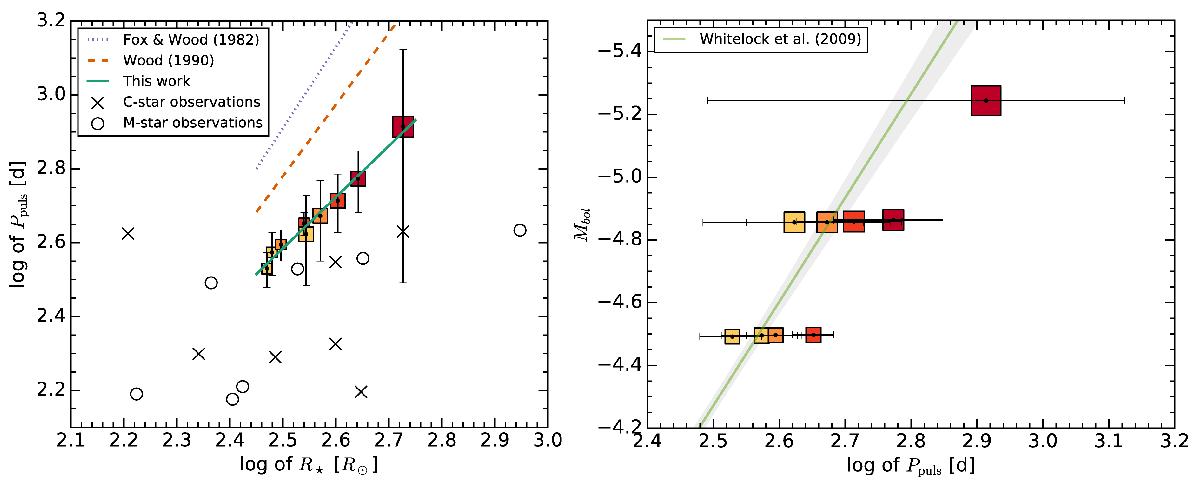
Left: logarithm of the period of the models plotted against the logarithm of the resulting radius with three different period-radius relations plotted. The green line indicates period-radius relations from this work, the orange dashed line indicates Wood (1990), and the purple dotted line indicates Fox & Wood (1982) for M = 1 M⊙. The error bars of the pulsation period of the models refer to the width of the peak in the power spectrum, that is, larger than the uncertainty of the period. The statistical error in the model radius is small. The typical error in the observed radii is about 31% due to uncertainties in the parallax. The crosses and circles are observations of C stars and M stars, respectively, with radius from the CHARM2 catalog (Richichi et al. 2005) and periods from GCVS catalog (Samus et al. 2009). Only stars with measured parallaxes were picked so that the distance determination is independent of the measured period (Ramstedt & Olofsson 2014). Right: the absolute magnitude against the logarithm of the period for all models. The error in the absolute magnitude is only due to the finite simulation time and is tiny (a few mmag). The line is taken from Whitelock et al. (2009) and is the P-L relation for AGB stars in the LMC, where the gray area is the 1σ error of the fit to the observations.
Current usage metrics show cumulative count of Article Views (full-text article views including HTML views, PDF and ePub downloads, according to the available data) and Abstracts Views on Vision4Press platform.
Data correspond to usage on the plateform after 2015. The current usage metrics is available 48-96 hours after online publication and is updated daily on week days.
Initial download of the metrics may take a while.