Fig. 6
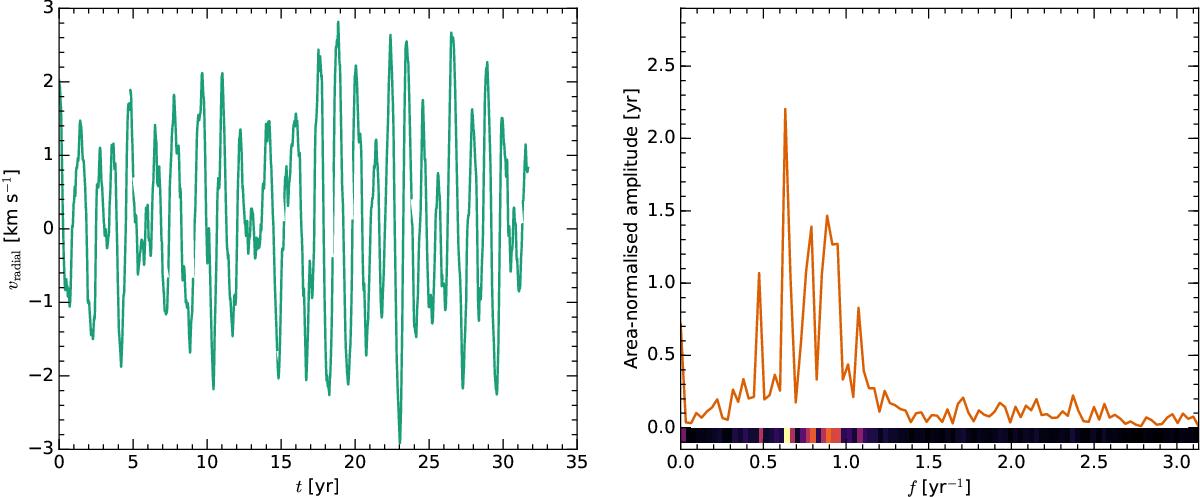
Examples for the standard model st28gm06n26: Left: the vertical velocity at a constant r = 301 R⊙, over 30 yr. Right: the power spectrum of the vertical velocity, shown to the left, showing the clearly dominant frequency. At the bottom of the panel, the density plot for this power spectrum is shown. This type of data is used in Fig. 7 for all radial points.
Current usage metrics show cumulative count of Article Views (full-text article views including HTML views, PDF and ePub downloads, according to the available data) and Abstracts Views on Vision4Press platform.
Data correspond to usage on the plateform after 2015. The current usage metrics is available 48-96 hours after online publication and is updated daily on week days.
Initial download of the metrics may take a while.