Fig. 5
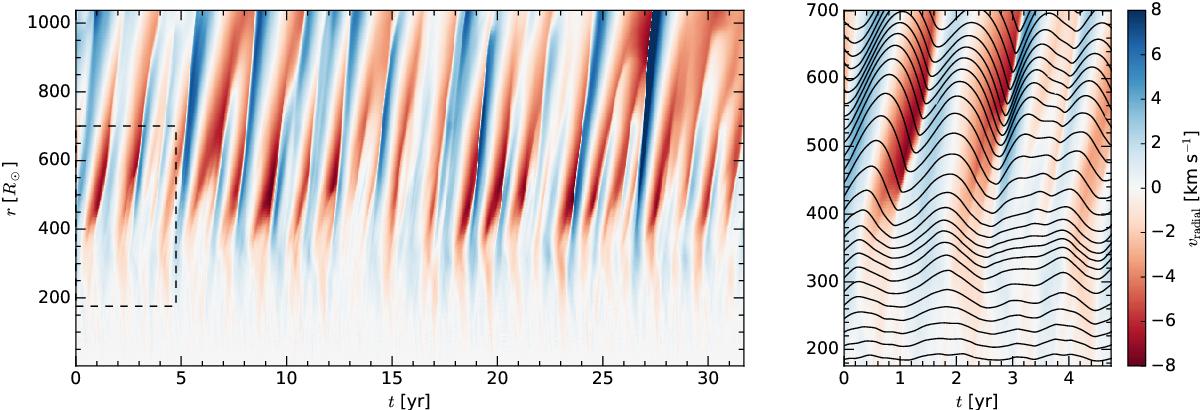
Examples for the standard model st28gm06n26: Left: the spherically averaged radial velocity ⟨ vradial ⟩ (r,t) for the full run time and radial distance. The different colors show the average vertical velocity at that time and radial distance. Right: part of the velocity field from the right image, indicated with the rectangle with mass-shell movements plotted as iso-mass contour lines.
Current usage metrics show cumulative count of Article Views (full-text article views including HTML views, PDF and ePub downloads, according to the available data) and Abstracts Views on Vision4Press platform.
Data correspond to usage on the plateform after 2015. The current usage metrics is available 48-96 hours after online publication and is updated daily on week days.
Initial download of the metrics may take a while.