Fig. 2
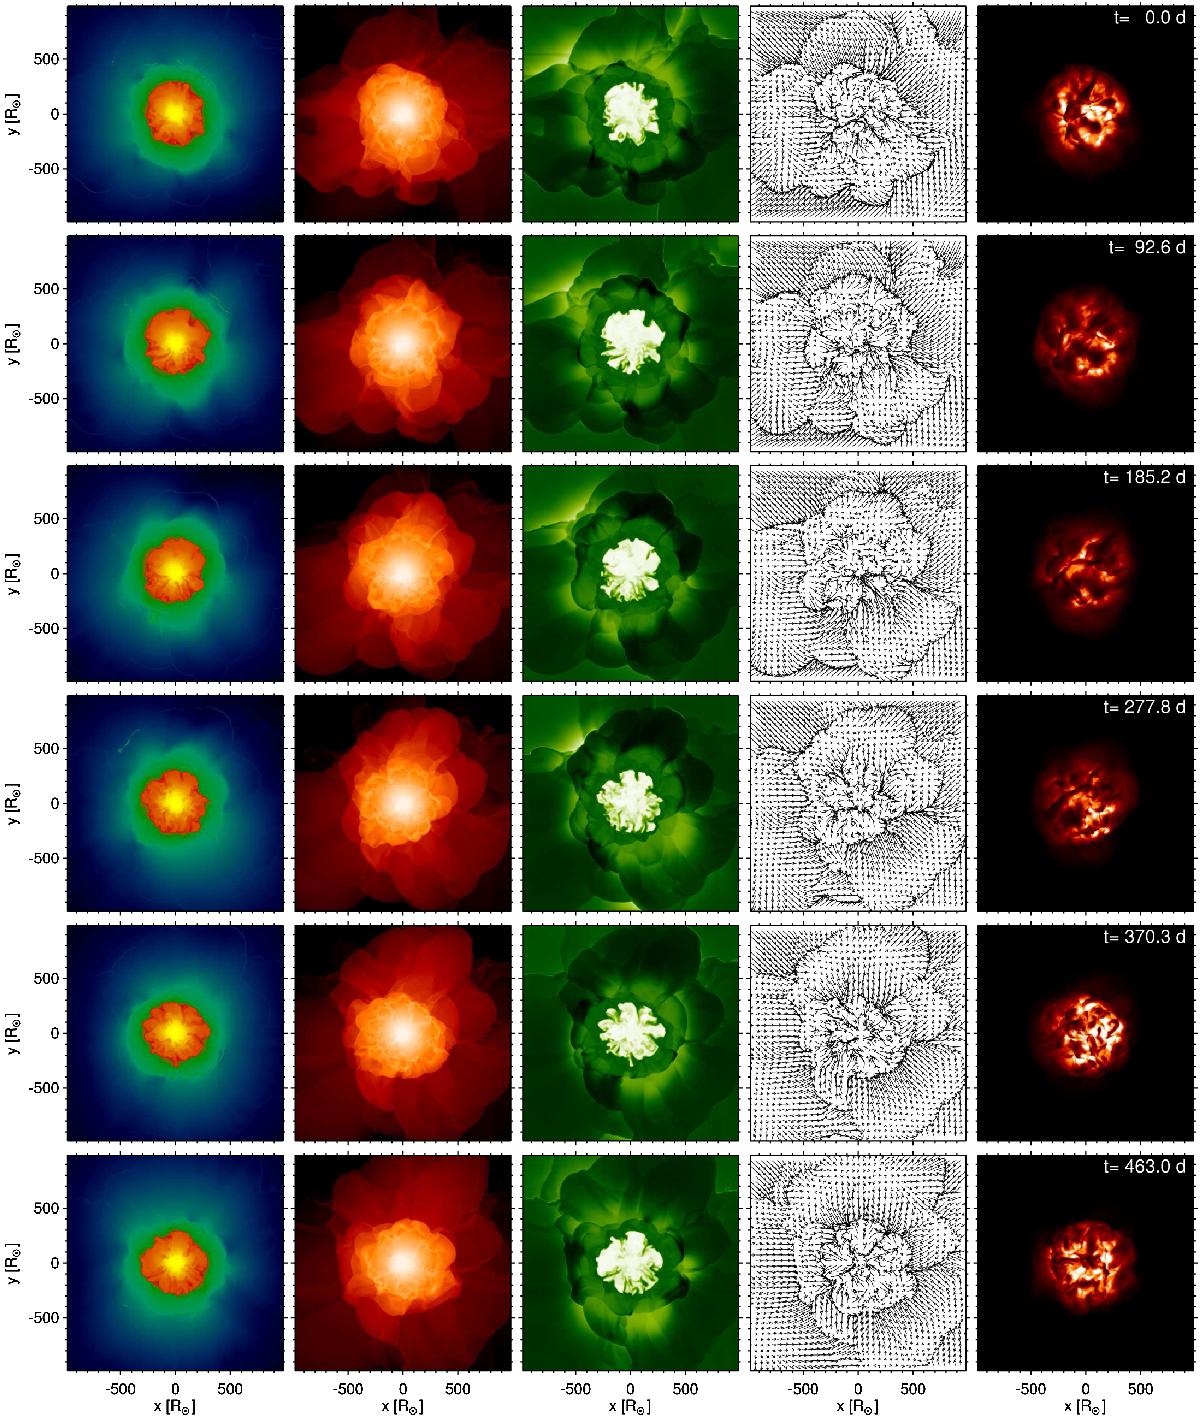
Time sequences (for the extended model st28gm06n25) of temperature slices, density slices, entropy slices, pseudo-streamlines (integrated over about 3 months), and bolometric intensity maps, where black corresponds to zero intensity. The snapshots are nearly 3 months apart (see the counter in the right-most panels), so that the entire sequence covers about one pulsational cycle. The color scales are kept the same for all snapshots. This figure can be directly compared to Fig. 1 of Freytag & Höfner (2008).
Current usage metrics show cumulative count of Article Views (full-text article views including HTML views, PDF and ePub downloads, according to the available data) and Abstracts Views on Vision4Press platform.
Data correspond to usage on the plateform after 2015. The current usage metrics is available 48-96 hours after online publication and is updated daily on week days.
Initial download of the metrics may take a while.