Fig. 12
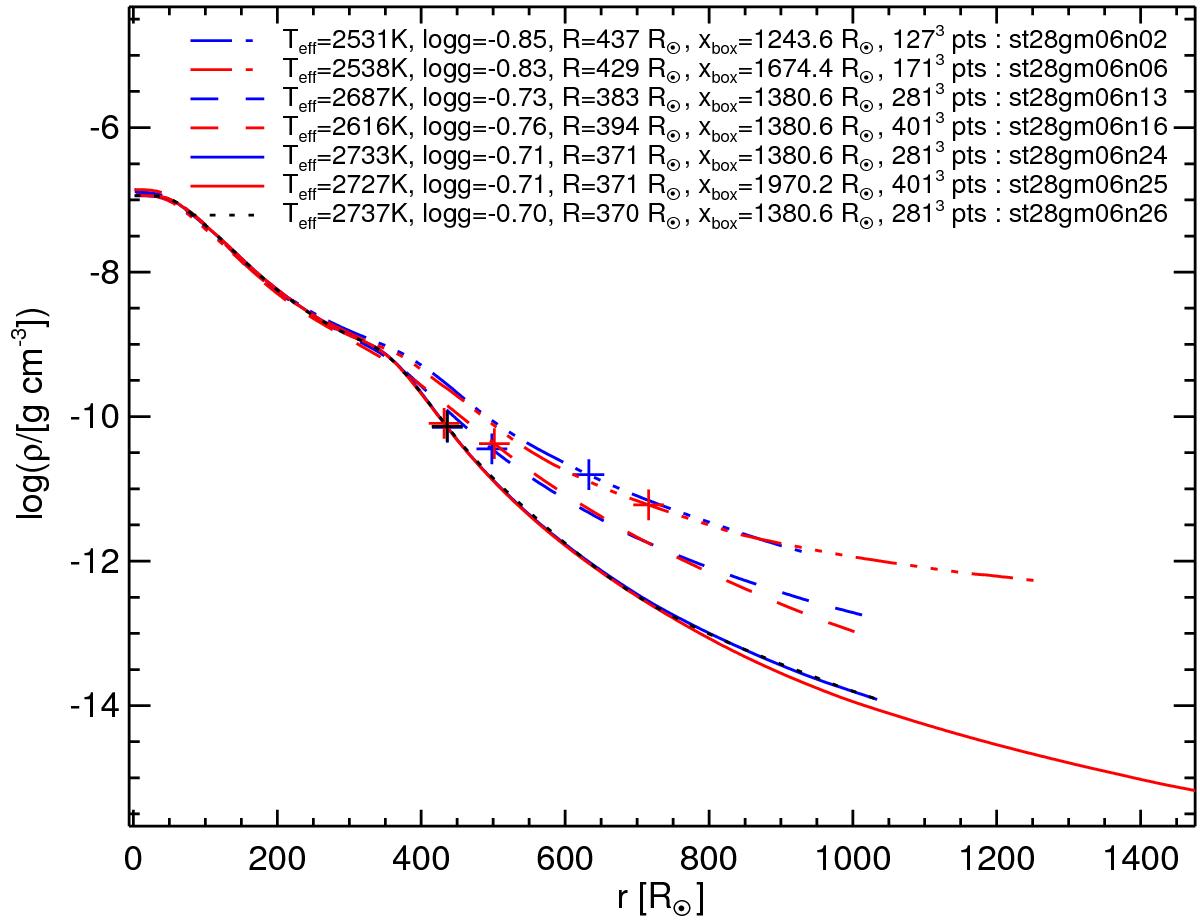
Logarithm of the gas density averaged over spherical shells and time for six models. The ordering in the legend essentially corresponds to the order of the curves. The plus signs roughly indicate the depth with τRoss = 1. In the legend, the effective temperature, surface gravity, edge length of the computational box, number of grid points, and the name are given for each model.
Current usage metrics show cumulative count of Article Views (full-text article views including HTML views, PDF and ePub downloads, according to the available data) and Abstracts Views on Vision4Press platform.
Data correspond to usage on the plateform after 2015. The current usage metrics is available 48-96 hours after online publication and is updated daily on week days.
Initial download of the metrics may take a while.