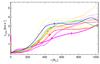
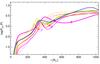
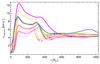
Fig. 10
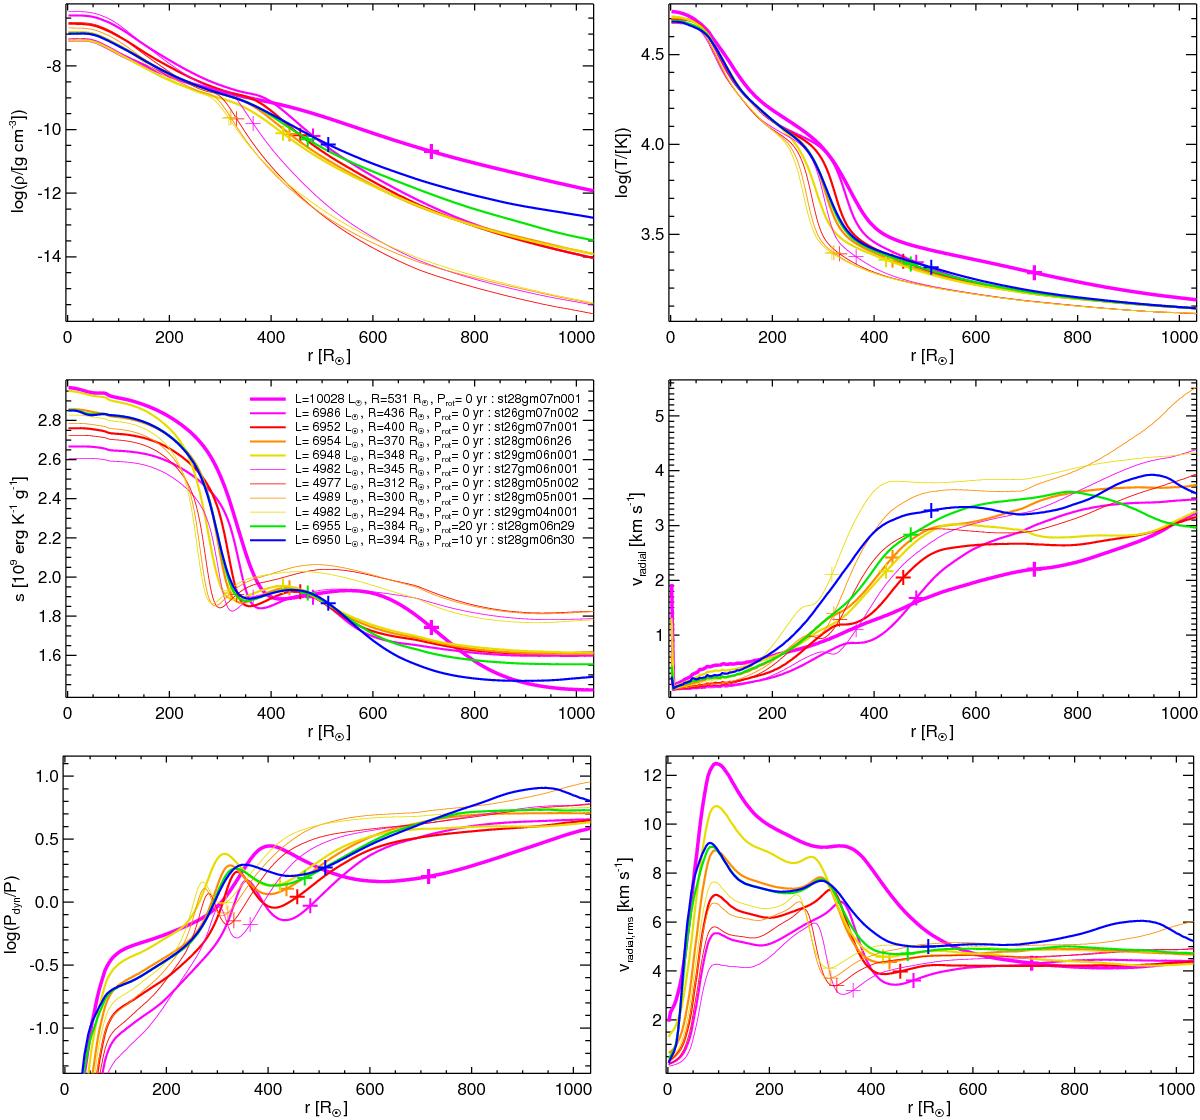
Plots of selected quantities, averaged over spherical shells and time vs. radii for all grid models. The plus signs roughly indicate the depth with τRoss = 1. Top left: logarithm of the mass density ρ. Top right: logarithm of the temperature T. Center left: entropy per mass unit s. Center right: temporal rms value of the spherically averaged radial velocity (includes mostly contributions from the radial pulsations). Bottom left: logarithm of the ratio of dynamical pressure Pdyn and gas pressure P. Bottom right: temporal and spatial rms value of the radial velocity (includes contributions both from convection and radial pulsations).
Current usage metrics show cumulative count of Article Views (full-text article views including HTML views, PDF and ePub downloads, according to the available data) and Abstracts Views on Vision4Press platform.
Data correspond to usage on the plateform after 2015. The current usage metrics is available 48-96 hours after online publication and is updated daily on week days.
Initial download of the metrics may take a while.