Fig. 6
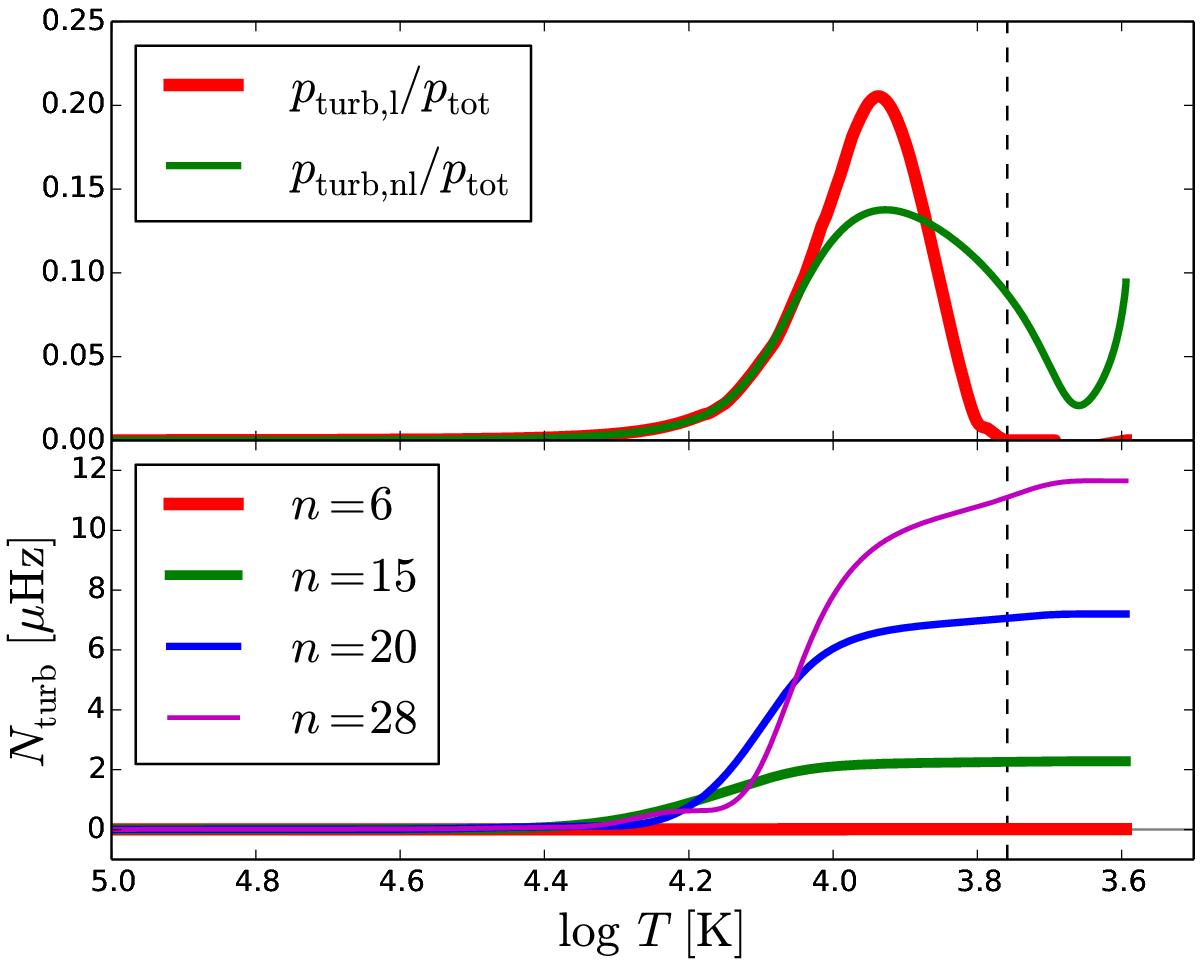
Top: ratios of the local (red) and nonlocal turbulent pressures (green) to the total one. Bottom: cumulative contribution of the turbulent pressure perturbation to the eigenfrequency, Nturb (Eq. (15)), for four radial modes with β = 0.2–1.2i. The horizontal axis is the logarithm of temperature. The vertical dashed line indicates the upper boundary of the convection zone determined by the Schwarzschild criterion.
Current usage metrics show cumulative count of Article Views (full-text article views including HTML views, PDF and ePub downloads, according to the available data) and Abstracts Views on Vision4Press platform.
Data correspond to usage on the plateform after 2015. The current usage metrics is available 48-96 hours after online publication and is updated daily on week days.
Initial download of the metrics may take a while.