Fig. 5
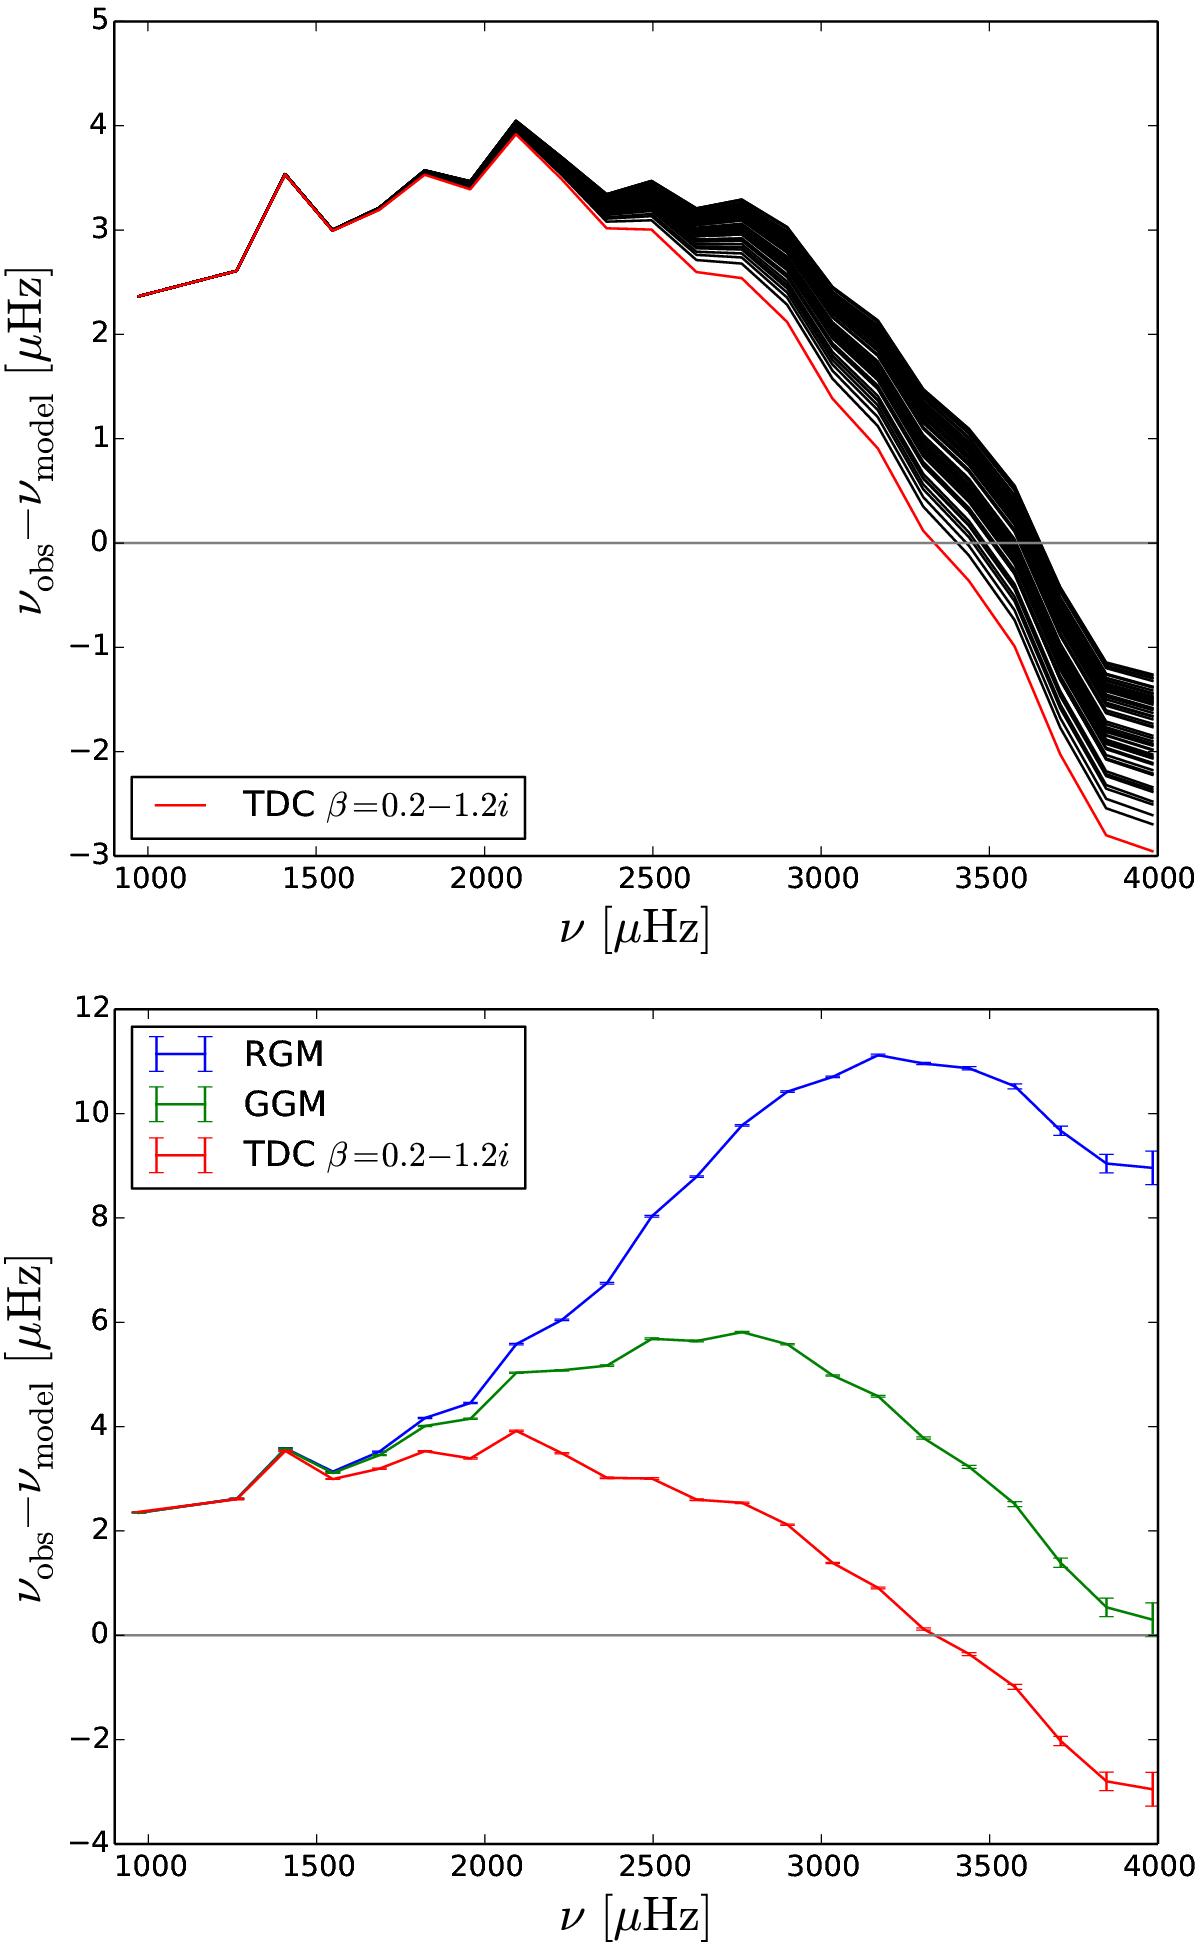
Same as Fig. 2, but for the model frequencies computed with TDC for PM. Top: black lines are for different values of the TDC free parameter β. The real part of β are ranged from 0.4 to 2.0, while the imaginary part from −2.0 to 2.0 at 0.4 intervals. The red line is for β = 0.2–1.2i, which gives the smallest deviation from the observed frequencies. Bottom: comparison of the case of β = 0.2–1.2i with GGM and RGM for PM.
Current usage metrics show cumulative count of Article Views (full-text article views including HTML views, PDF and ePub downloads, according to the available data) and Abstracts Views on Vision4Press platform.
Data correspond to usage on the plateform after 2015. The current usage metrics is available 48-96 hours after online publication and is updated daily on week days.
Initial download of the metrics may take a while.