Free Access
Fig. 2
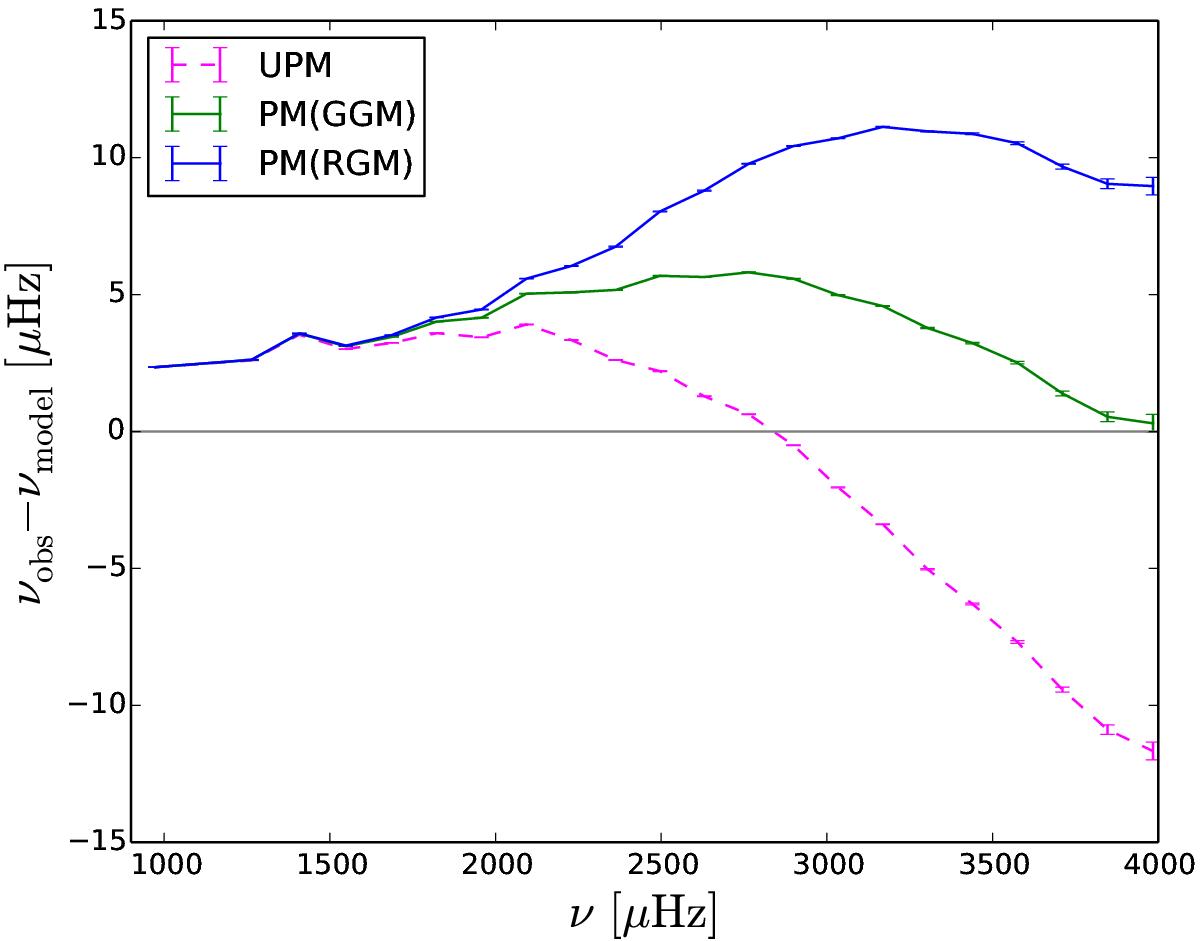
Difference between the model and observed frequencies (Broomhall et al. 2009) for the radial modes. The error bars stem from the observation. The magenta dashed line is for UPM, and the blue and green solid lines are for PM with the RGM and GGM, respectively. The model frequencies are computed by ADIPLS.
Current usage metrics show cumulative count of Article Views (full-text article views including HTML views, PDF and ePub downloads, according to the available data) and Abstracts Views on Vision4Press platform.
Data correspond to usage on the plateform after 2015. The current usage metrics is available 48-96 hours after online publication and is updated daily on week days.
Initial download of the metrics may take a while.