Fig. 1
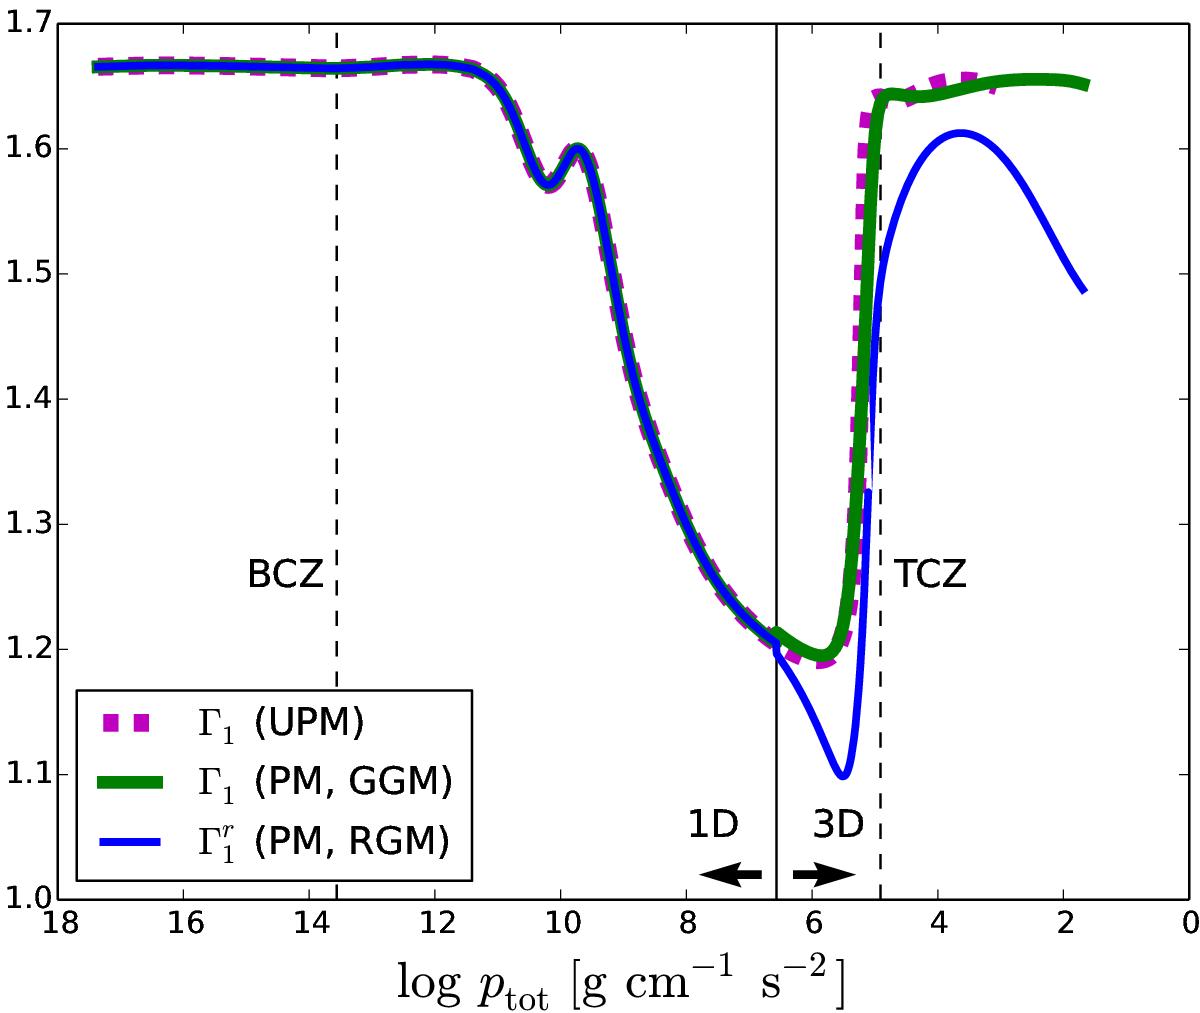
Adiabatic exponent as a function of total pressure in UPM (dashed magenta line) and PM (solid green and blue lines). For PM, ones for the GGM (Γ1, green) and for the RGM (![]() , blue) are shown as functions of the total pressure. The vertical solid line indicates the matching point between 1D and 3D models. The vertical dashed lines indicate the bottom and top of the convection zone determined by the Schwarzschild criterion, labelled as BCZ and TCZ, respectively.
, blue) are shown as functions of the total pressure. The vertical solid line indicates the matching point between 1D and 3D models. The vertical dashed lines indicate the bottom and top of the convection zone determined by the Schwarzschild criterion, labelled as BCZ and TCZ, respectively.
Current usage metrics show cumulative count of Article Views (full-text article views including HTML views, PDF and ePub downloads, according to the available data) and Abstracts Views on Vision4Press platform.
Data correspond to usage on the plateform after 2015. The current usage metrics is available 48-96 hours after online publication and is updated daily on week days.
Initial download of the metrics may take a while.