Fig. 7
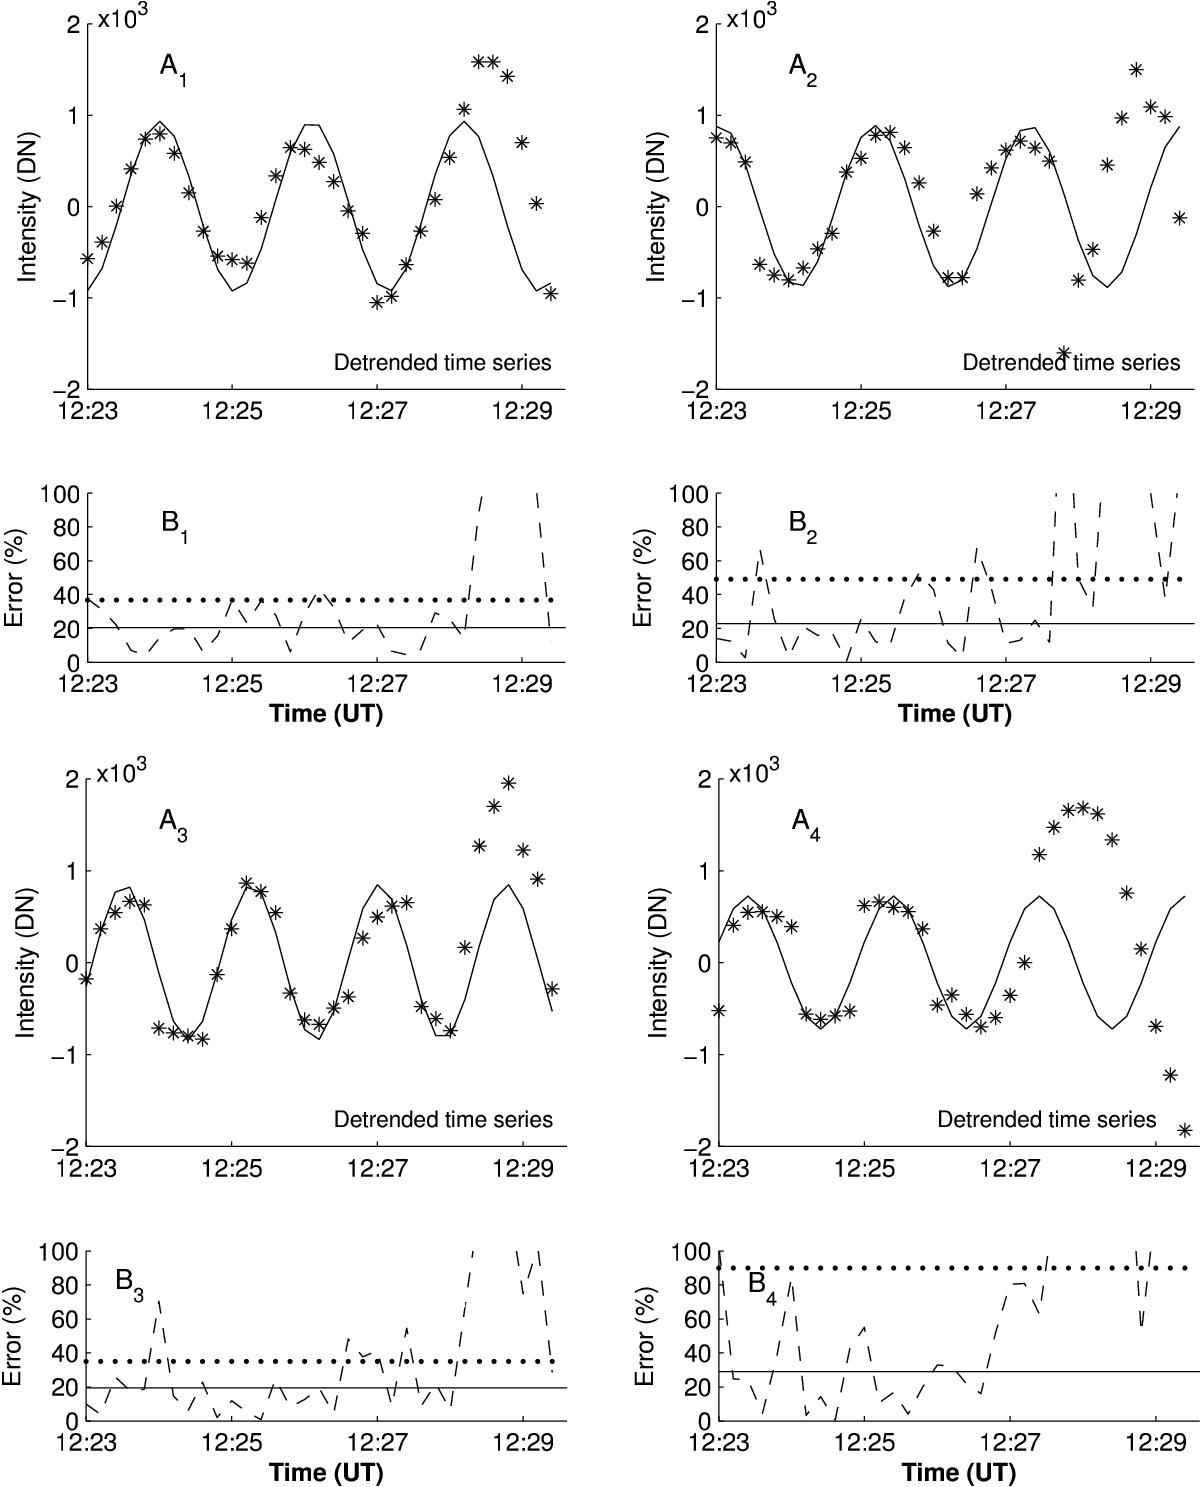
Analysis of the piecewise de-trended data corresponding to Fig. 6. Panels Ak,k = 1,2,3,4 show the evolution of de-trended intensity (shown with asterisks) for the first four bright blobs (1 to 4), respectively (see Fig. 4) fitted by sin functions (solid lines). Panels Bk,k = 1,2,3,4 show the fitting errors with dashed lines. The dotted horizontal lines represent the average error for the whole considered time span and the solid horizontal lines show the average error corresponding to the shorter time span up to approximately 12:28 UT.
Current usage metrics show cumulative count of Article Views (full-text article views including HTML views, PDF and ePub downloads, according to the available data) and Abstracts Views on Vision4Press platform.
Data correspond to usage on the plateform after 2015. The current usage metrics is available 48-96 hours after online publication and is updated daily on week days.
Initial download of the metrics may take a while.