Fig. 4
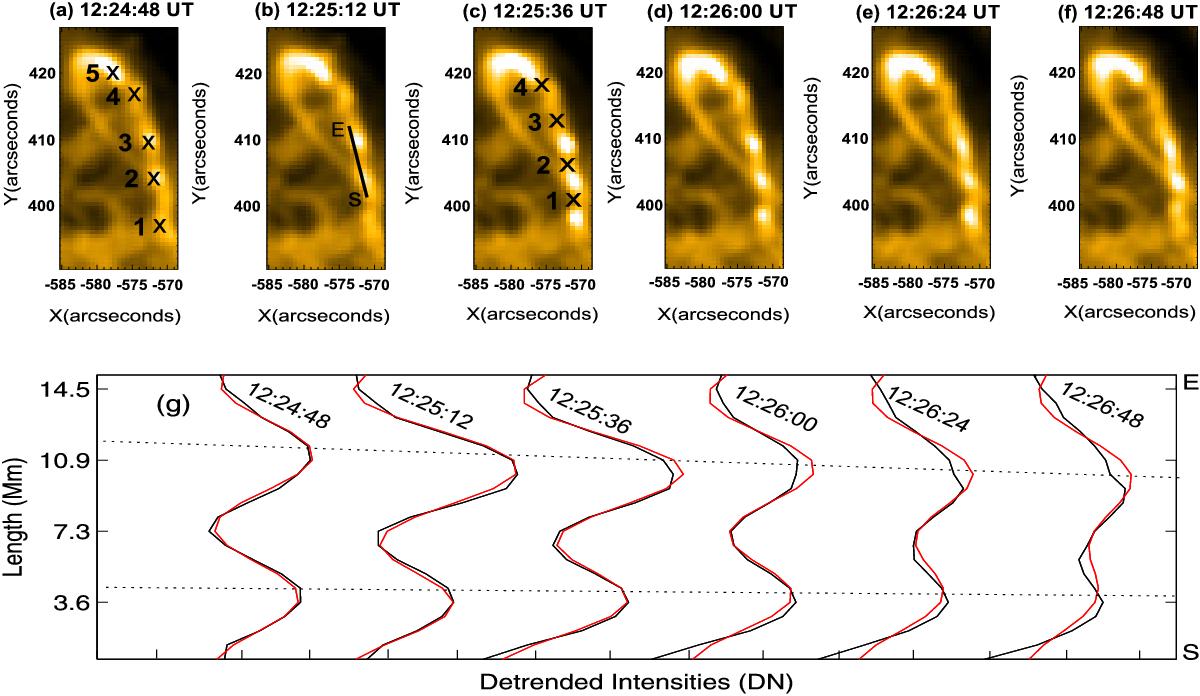
Spatial periodicity of L1 loop and its evolution. Panels a)–f) show a temporal sequence of the L1 loop in the period of 12:24:48 UT –12:26:48 UT. Five bright blobs are indicated with crosses on panel a). Panel b) shows a one pixel cut from starting point S to the ending point E, and the corresponding de-trended intensity curves (black) are shown on panel g), fitted with the function asin (bx + c) with the red lines. Intensity varies by ±2000DN. The blobs do not show significant movement. Panel c) shows four intensity minima points between neighboring bright blobs.
Current usage metrics show cumulative count of Article Views (full-text article views including HTML views, PDF and ePub downloads, according to the available data) and Abstracts Views on Vision4Press platform.
Data correspond to usage on the plateform after 2015. The current usage metrics is available 48-96 hours after online publication and is updated daily on week days.
Initial download of the metrics may take a while.