Fig. 4
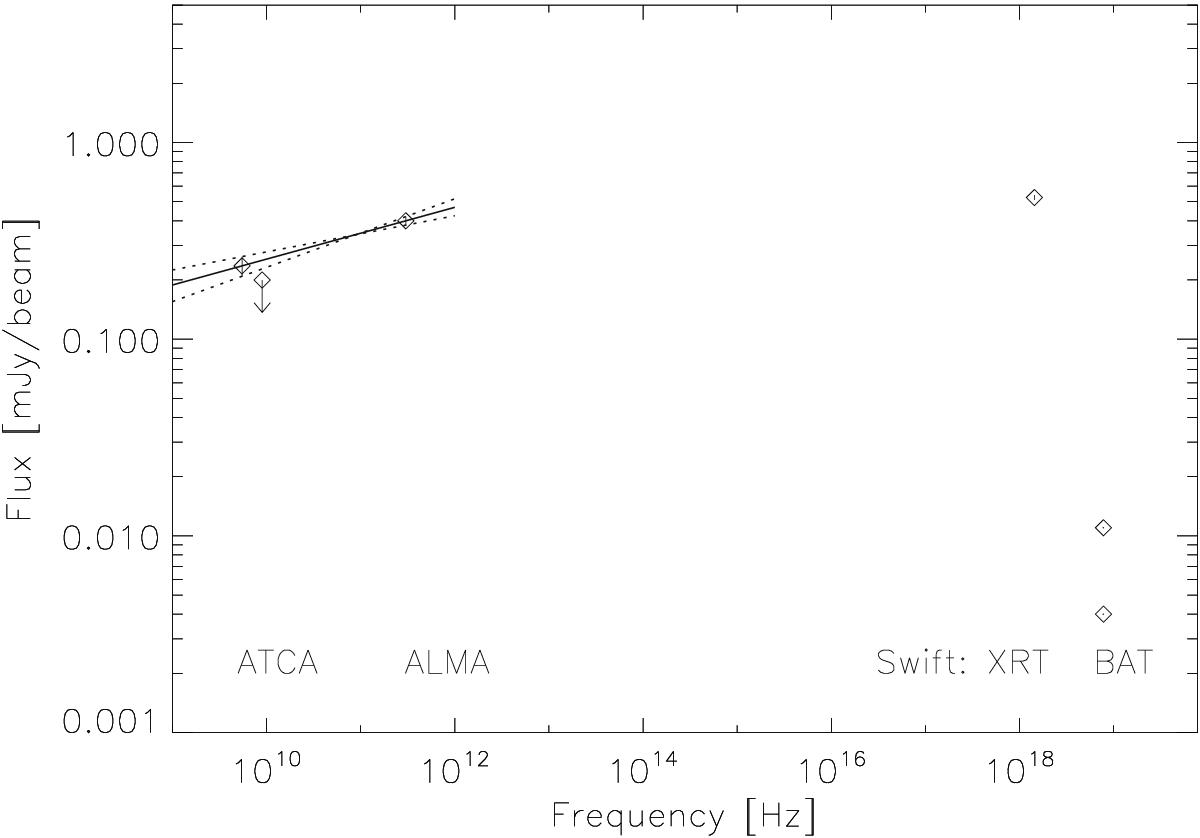
SED for 4U 1820−30. We fit the broad-band spectrum with a power law of index α = 0.13 ± 0.04. The upper limit at 9 GHz was not considered to perform the fit. The Swift/XRT point corresponds to the (almost identical) fluxes on the days before and after the ALMA and ATCA observations (see Table 1). The Swift/BAT points correspond to the flux densities derived in Sect. 3.2 for observations on the days before and after the ALMA and ATCA observations (see Table 1).
Current usage metrics show cumulative count of Article Views (full-text article views including HTML views, PDF and ePub downloads, according to the available data) and Abstracts Views on Vision4Press platform.
Data correspond to usage on the plateform after 2015. The current usage metrics is available 48-96 hours after online publication and is updated daily on week days.
Initial download of the metrics may take a while.