Free Access
Fig. 2
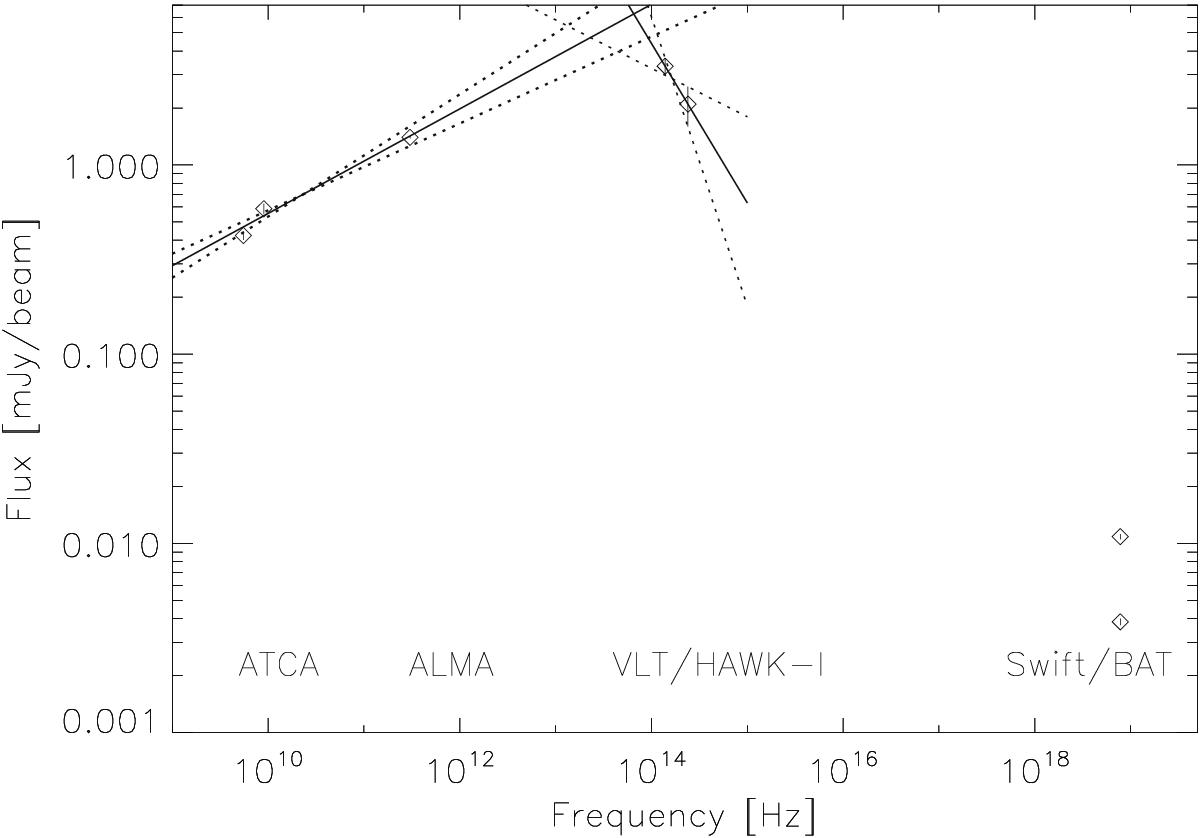
SED for 4U 1728−34. We fit the broad-band spectrum with power laws of indices α = 0.28 ± 0.05 and α = –0.8 ± 0.7 below and above ~6.5 × 10¹³ Hz, respectively. The Swift/BAT points correspond to the flux densities derived in Sect. 3.1 for observations before and after the ALMA observations (see Table 1).
Current usage metrics show cumulative count of Article Views (full-text article views including HTML views, PDF and ePub downloads, according to the available data) and Abstracts Views on Vision4Press platform.
Data correspond to usage on the plateform after 2015. The current usage metrics is available 48-96 hours after online publication and is updated daily on week days.
Initial download of the metrics may take a while.