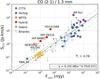
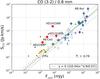
Fig. 7

a) CO J = 2 → 1 emission plotted with the corresponding continuum measurement, the fluxes being normalized at 100 pc. Blue corresponds to CTTS, violet to Herbig, orange to WTTS, red to hybrid and green to debris disks. The open circles mark the binary systems. The Pearson coefficient of correlation of the data, Pc, is indicated in the lower right-hand corner. b) As for Fig. 7a but for the CO J = 3 → 2/0.8 mm emission.
Current usage metrics show cumulative count of Article Views (full-text article views including HTML views, PDF and ePub downloads, according to the available data) and Abstracts Views on Vision4Press platform.
Data correspond to usage on the plateform after 2015. The current usage metrics is available 48-96 hours after online publication and is updated daily on week days.
Initial download of the metrics may take a while.