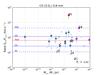
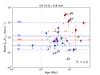
Fig. C.3

Left: ratio SCO/Fcont plotted against the accretion rate, at 0.8 mm. The color code and lines are the same as in Fig. 11. The Pearson coefficient of correlation of the data, Pc, is indicated in the lower right-hand corner. Right: ratio SCO/Fcont plotted against the age of the system, at 0.8 mm. The color code and lines are the same as in Fig. 12. The Pearson coefficient of correlation of the data, Pc, is indicated in the lower right-hand corner.
Current usage metrics show cumulative count of Article Views (full-text article views including HTML views, PDF and ePub downloads, according to the available data) and Abstracts Views on Vision4Press platform.
Data correspond to usage on the plateform after 2015. The current usage metrics is available 48-96 hours after online publication and is updated daily on week days.
Initial download of the metrics may take a while.