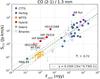
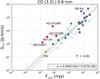
Fig. B.2

a) Emission of the CO J = 2 → 1 plotted against the 1.3 mm continuum emission. The Pearson coefficient of correlation of the data, Pc, is indicated in the lower right-hand corner. No extrapolated data are used here, only observations are reported and used to do the linear regression (green full line, equation indicated in the lower right-hand corner). b) Same as a), for the CO J = 3 → 2 emission against the 0.8 mm continuum emission. Fluxes are rescaled at 100 pc.
Current usage metrics show cumulative count of Article Views (full-text article views including HTML views, PDF and ePub downloads, according to the available data) and Abstracts Views on Vision4Press platform.
Data correspond to usage on the plateform after 2015. The current usage metrics is available 48-96 hours after online publication and is updated daily on week days.
Initial download of the metrics may take a while.