Fig. 7
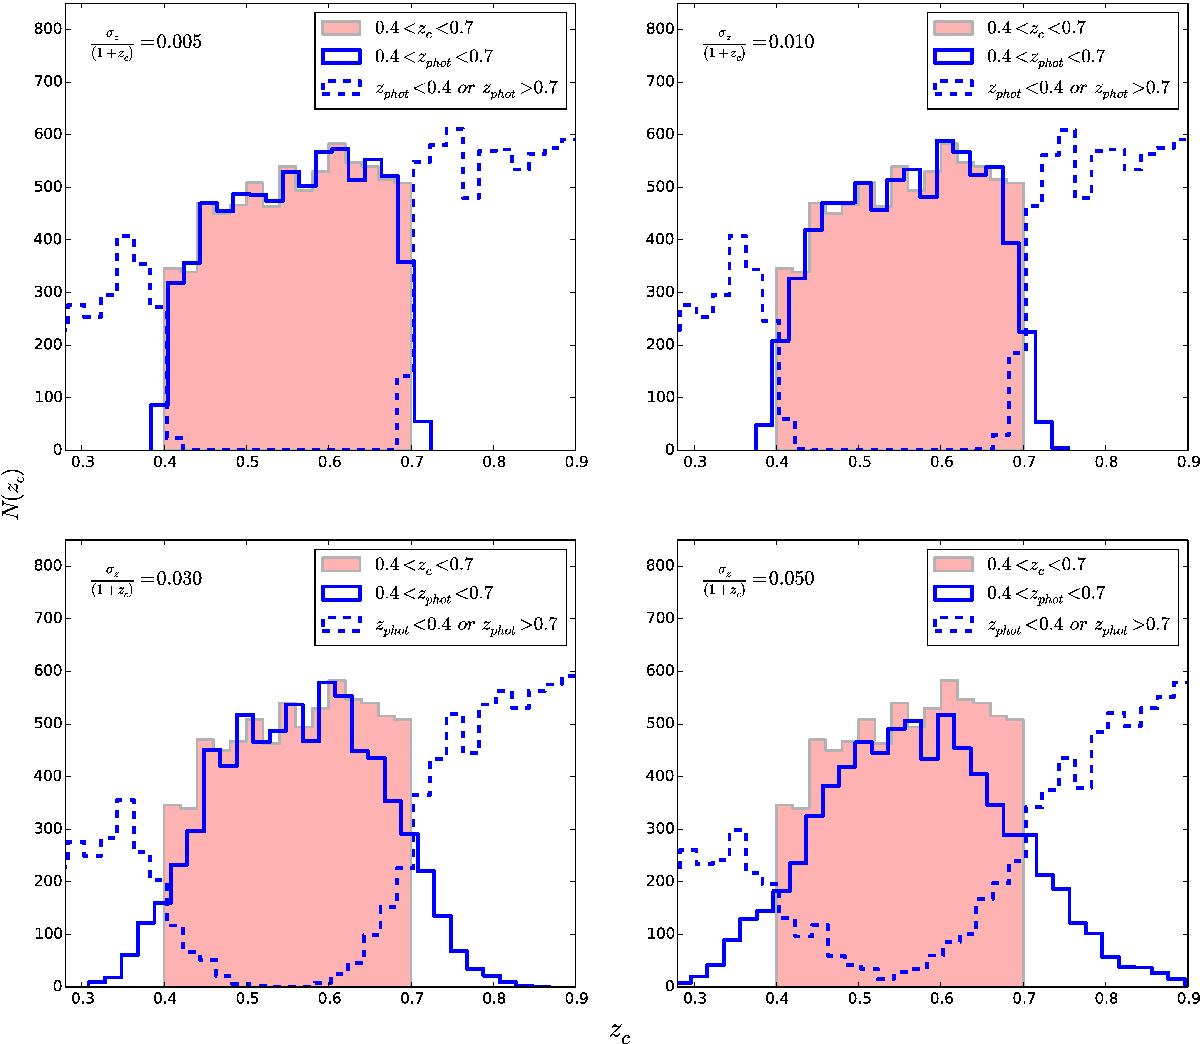
Distribution of clusters selected in the top-hat cosmological redshift window compared with the clusters selected in the top-hat photometric redshift window. Filled histograms correspond to distribution of clusters as a function of cosmological redshift when the top-hat selection is done using the cosmological redshift within the range 0.4 < z < 0.7. Solid blue lines correspond to distribution of clusters as a function of cosmological redshift when the top-hat selection is done using the different photometric uncertainties we have used (σz/ (1 + zc) = 0.005, 0.010, 0.030 and 0.050) with the range 0.4 < z < 0.7 and the dashed blue lines correspond to the distribution of clusters as a function of cosmological redshift when the top-hat selection is done using photometric redshifts outside the range 0.4 < z < 0.7.
Current usage metrics show cumulative count of Article Views (full-text article views including HTML views, PDF and ePub downloads, according to the available data) and Abstracts Views on Vision4Press platform.
Data correspond to usage on the plateform after 2015. The current usage metrics is available 48-96 hours after online publication and is updated daily on week days.
Initial download of the metrics may take a while.