Fig. 6
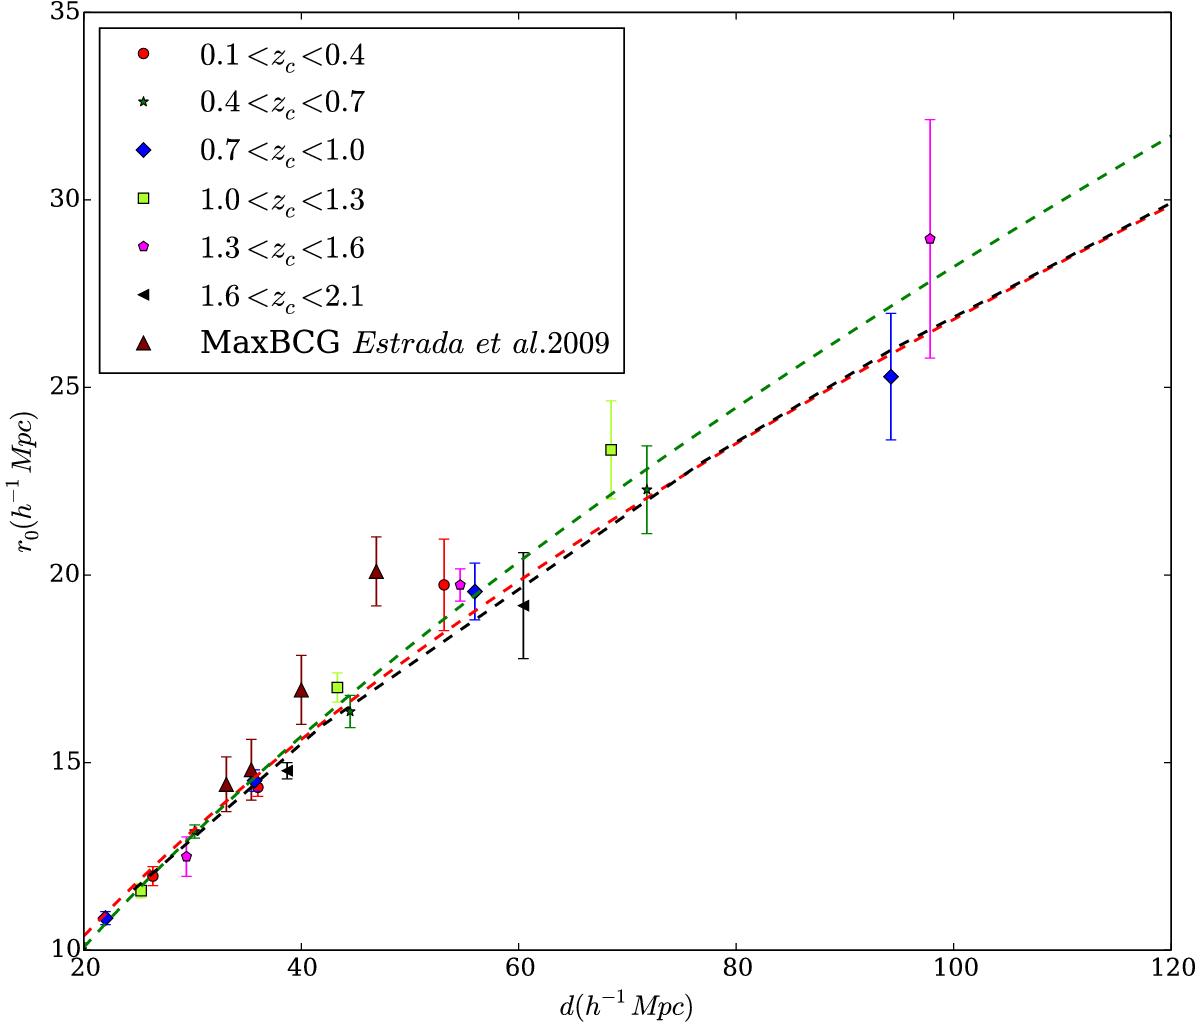
Evolution of r0 with d for clusters of different masses in different redshift slices. The points plotted are for the fixed slope γ = 2.0. The green dashed line shows the fit when γ = 2.0 and the red dashed line shows the overall fit obtained for the data points considering a free slope. The analytic approximation in the ΛCDM case obtained by Younger et al. (2005) is shown by the dashed black line. The different redshift slices are colour coded as mentioned in the figure.
Current usage metrics show cumulative count of Article Views (full-text article views including HTML views, PDF and ePub downloads, according to the available data) and Abstracts Views on Vision4Press platform.
Data correspond to usage on the plateform after 2015. The current usage metrics is available 48-96 hours after online publication and is updated daily on week days.
Initial download of the metrics may take a while.