Fig. 5
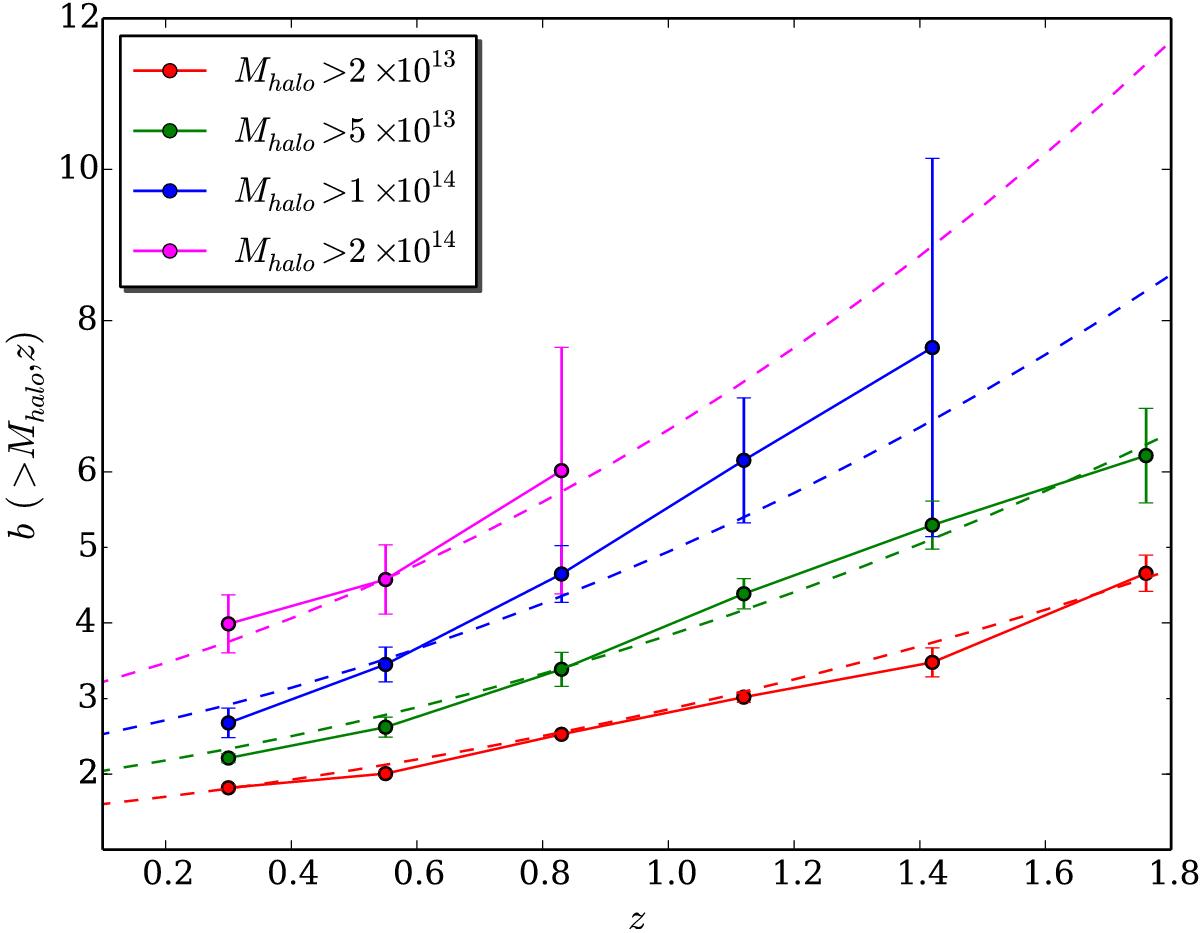
Bias as a function of redshift for different limiting masses (with units h-1M⊙) where the solid lines just connect the points. The dashed line is the theoretical expectation of the bias as given by Tinker et al. (2010) for the same limiting masses and evolving redshift. The different limiting masses are colour coded as shown in the figure. The bias values for all the samples can be found in Table 1.
Current usage metrics show cumulative count of Article Views (full-text article views including HTML views, PDF and ePub downloads, according to the available data) and Abstracts Views on Vision4Press platform.
Data correspond to usage on the plateform after 2015. The current usage metrics is available 48-96 hours after online publication and is updated daily on week days.
Initial download of the metrics may take a while.