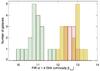
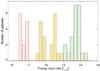
Fig. 4
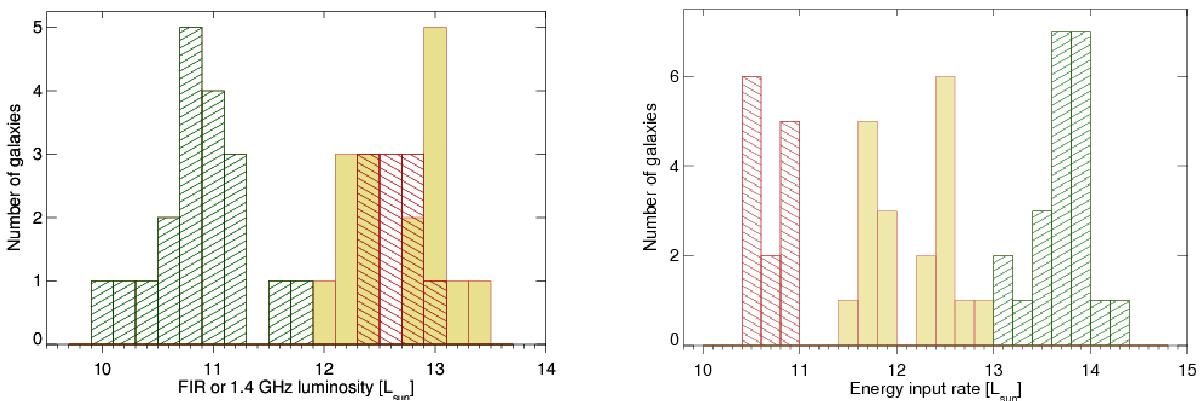
Left: FIR luminosity between 8 and 1000 μm, and the 1.4 GHz monochromatic power, i.e., the quantities used to estimate the kinetic energy of the different possible drivers discussed in this paper. The yellow filled, red hatched, and green hatched diagrams correspond to bolometric AGN power, star formation, and radio power, respectively. We only include sources with Herschel detections. Right: same histograms showing the kinetic energy corresponding to the FIR luminosity and monochromatic radio power at 1.4 GHz, derived with the methods described in Sects. 5 and 6.
Current usage metrics show cumulative count of Article Views (full-text article views including HTML views, PDF and ePub downloads, according to the available data) and Abstracts Views on Vision4Press platform.
Data correspond to usage on the plateform after 2015. The current usage metrics is available 48-96 hours after online publication and is updated daily on week days.
Initial download of the metrics may take a while.