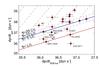
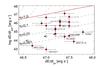
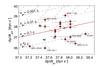
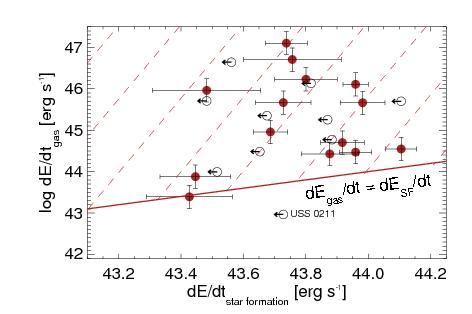
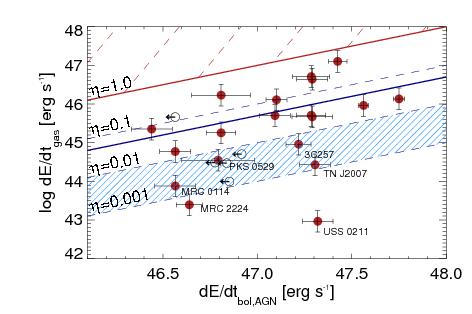
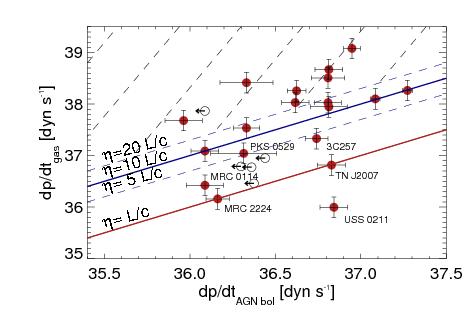
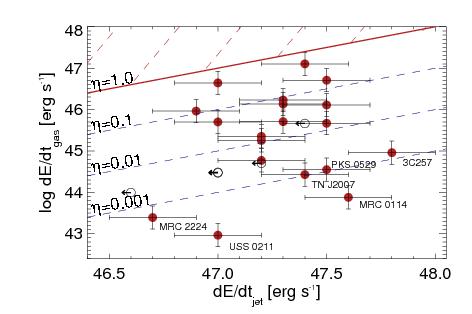
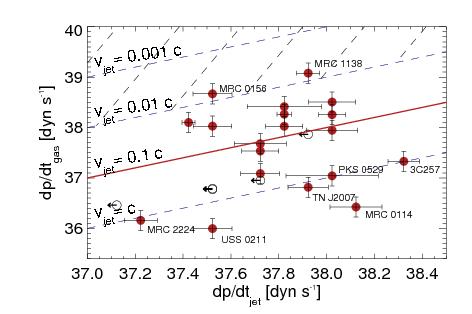
Fig. 3
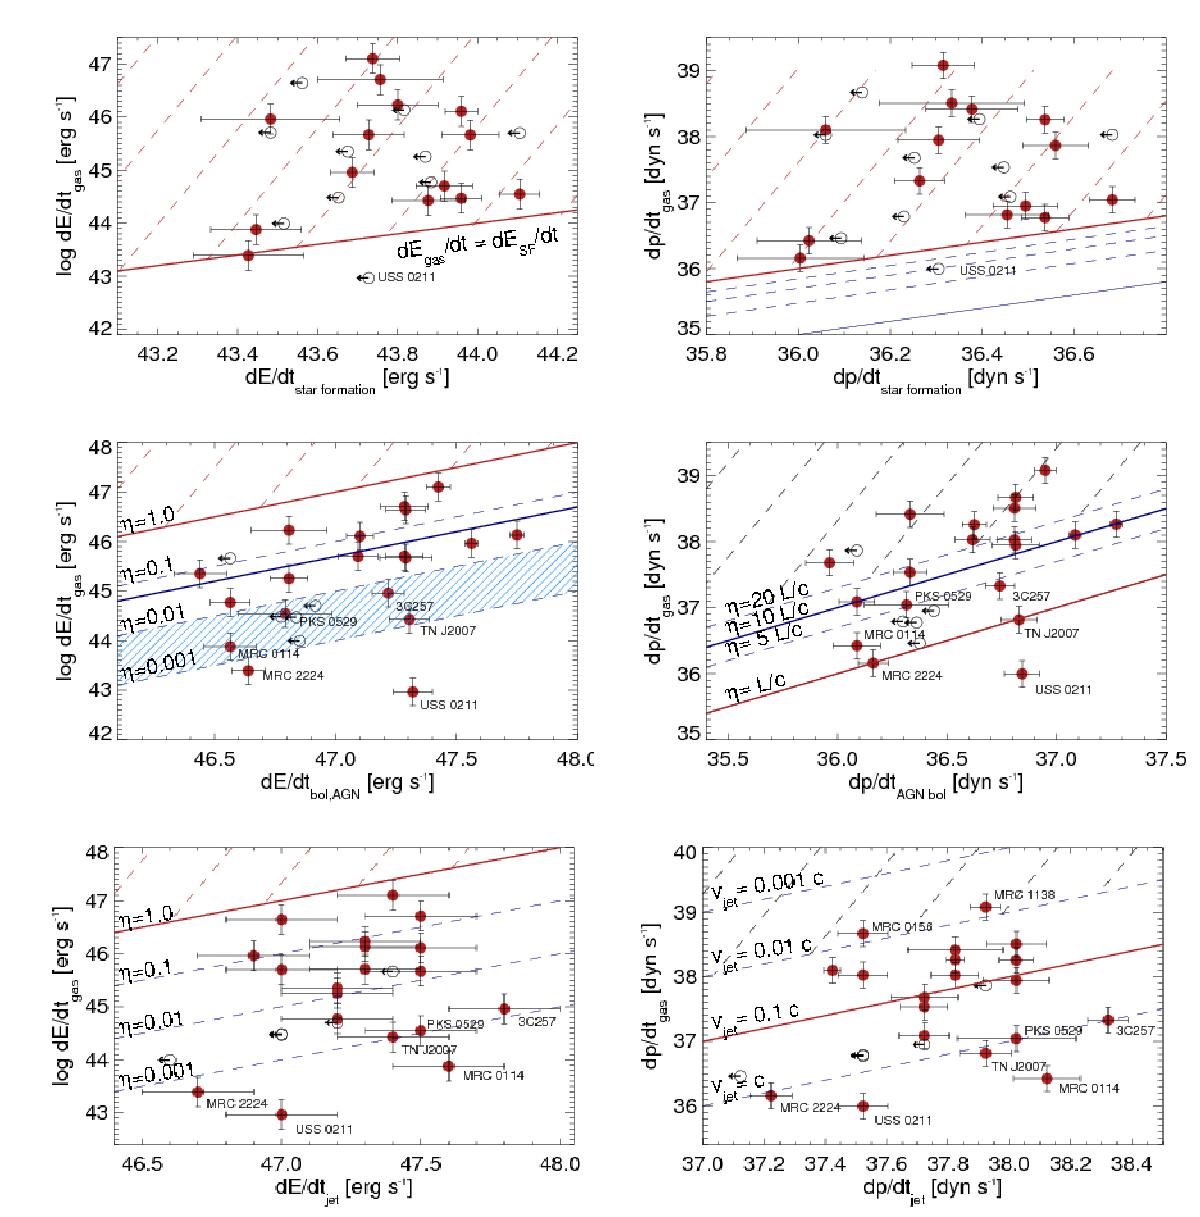
Relationships between the observed kinetic energy (left) and momentum (right) of the gas, for star formation (top), AGN radiation (center) and radio jets (bottom). Filled red and empty black dots show galaxies with FIR detections and upper limits, respectively. Error bars show the measurement uncertainties. Red wide-spaced dashed regions are excluded by energy and momentum conservation, black wide-spaced dashed regions by empirical constraints on the maximum momentum transfer from AGN radiation and radio jet, respectively. In the top right panel, the red and blue solid lines show momentum transfer of 100 and 10% of that provided by star formation, respectively. Heckman et al. (2015) argued that 10% efficiency is most likely. Thin dashed dark blue lines show transfer rates of 30, 50, and 70%. In the middle left panel, the red line shows an energy transfer of 100%, the blue line 5% required by cosmological models, the hatched region of 0.1–1% of Lbol to gas kinetic energy. The latter is favored by observations of FeLoBALs (Moe et al. 2009; Dunn et al. 2010; Bautista et al. 2010) and hydrodynamic models taking radiative transfer explicitly into account (Bieri et al. 2017; Krumholz & Thompson 2012). The same observations and models also favor an average momentum transfer of L/c (red line in the middle right panel), whereas more optimistic models find L/c ~ 10 (dark blue solid line; Zubovas & King 2012; Faucher-Giguère & Quataert 2012). In the bottom left panel, the red solid line represents an energy transfer of 100% from jet to gas, and in the bottom right panel the momentum transfer for the most likely jet expansion velocity of 0.1c. Dashed dark blue lines show the momentum input from the jet for different assumptions of the jet advance speed, assuming that no momentum is lost to other effects. It is therefore not impossible to find galaxies below the line for a jet expansion at the speed of light, c (lowest dark-blue dashed line), due to geometry, gas clumpiness, and other effects.
Current usage metrics show cumulative count of Article Views (full-text article views including HTML views, PDF and ePub downloads, according to the available data) and Abstracts Views on Vision4Press platform.
Data correspond to usage on the plateform after 2015. The current usage metrics is available 48-96 hours after online publication and is updated daily on week days.
Initial download of the metrics may take a while.