Fig. 5
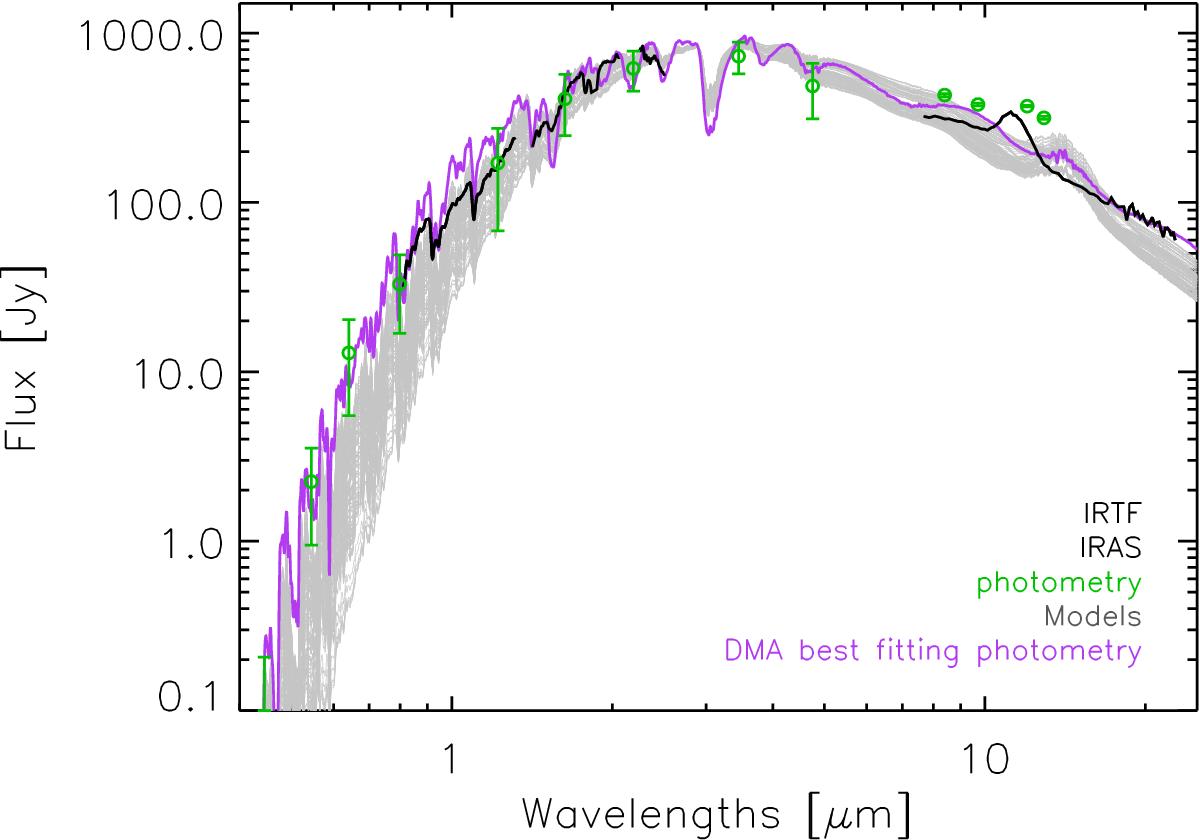
Observational spectro-photometric data of R Lep, compared with the synthetic spectrum of the best-fitting time-step (violet). Photometry is plotted in green circles, while IRAS (Olnon et al. 1986) and NASA/IRTF (Rayner et al. 2009) spectra are plotted as black lines to allow qualitative verification of the photometric fit. The spectrum of the DARWIN models, for which the synthetic photometry fits best the corresponding observational data, is shown in violet.
Current usage metrics show cumulative count of Article Views (full-text article views including HTML views, PDF and ePub downloads, according to the available data) and Abstracts Views on Vision4Press platform.
Data correspond to usage on the plateform after 2015. The current usage metrics is available 48-96 hours after online publication and is updated daily on week days.
Initial download of the metrics may take a while.