Fig. 4
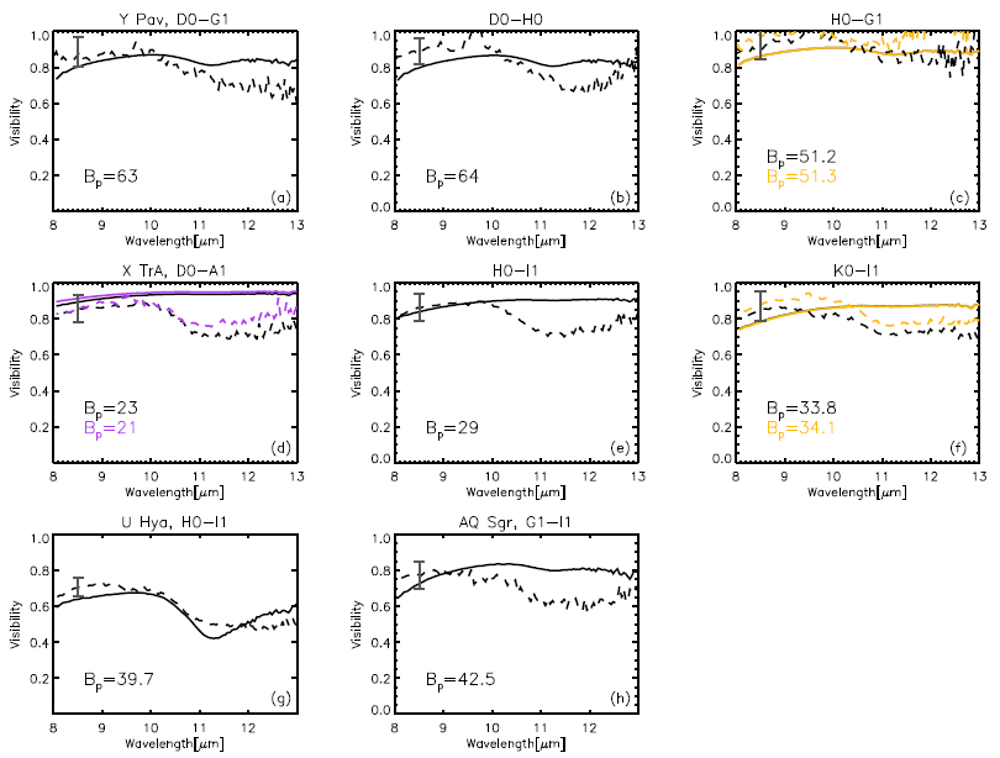
As in Fig. 3, for the semi-regular and irregular stars of our sample: Y Pav in panels a), b), c); X TrA in panels d), e), f); U Hya in panel g) and AQ Sgr in panel f). Error bars are of the order of 10%, and a typical error-size bar is shown in gray in each panel, overlapping with the data at 8.5 μm. Panels c), d), and f) show the two full lines (models) that overlap.
Current usage metrics show cumulative count of Article Views (full-text article views including HTML views, PDF and ePub downloads, according to the available data) and Abstracts Views on Vision4Press platform.
Data correspond to usage on the plateform after 2015. The current usage metrics is available 48-96 hours after online publication and is updated daily on week days.
Initial download of the metrics may take a while.