Fig. 3
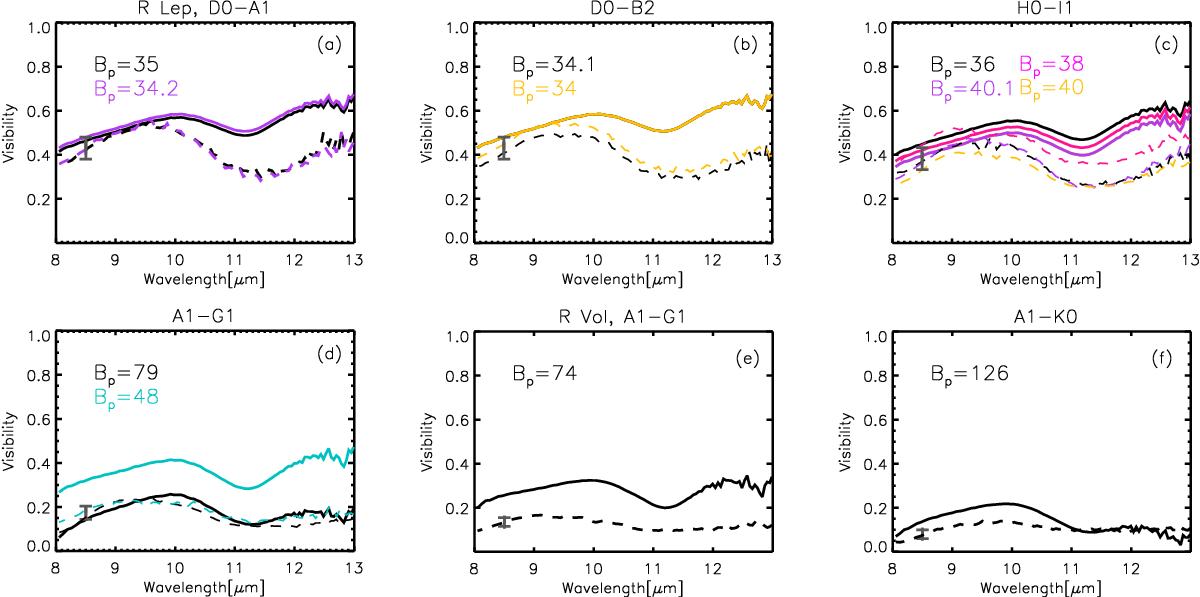
Visibility dispersed over wavelengths of the Mira variables of our sample. Models are plotted in full lines, observations in dashed lines, at the different projected baselines (see color legend). The stars are identified in the title. The six panels show R Lep dispersed visibilities at the baseline configuration D0-A1 a); D0-B2 b); H0-I1 c); and A1-G1 d), as also marked in the plot titles. R Vol dispersed visibilities are at the baseline configuration A1-G1 e) and A1-K0 f). Error bars are of the order of 10%, and a typical error-size bar is shown in gray in each panel, overlapping with the data at 8.5 μm. In panel a), the two models’ full lines are overlapping, as the two observations lines. In panel d), the two lines of the observations are overlapping, and the model at Bp = 79 also lies on top of them.
Current usage metrics show cumulative count of Article Views (full-text article views including HTML views, PDF and ePub downloads, according to the available data) and Abstracts Views on Vision4Press platform.
Data correspond to usage on the plateform after 2015. The current usage metrics is available 48-96 hours after online publication and is updated daily on week days.
Initial download of the metrics may take a while.