Fig. 13
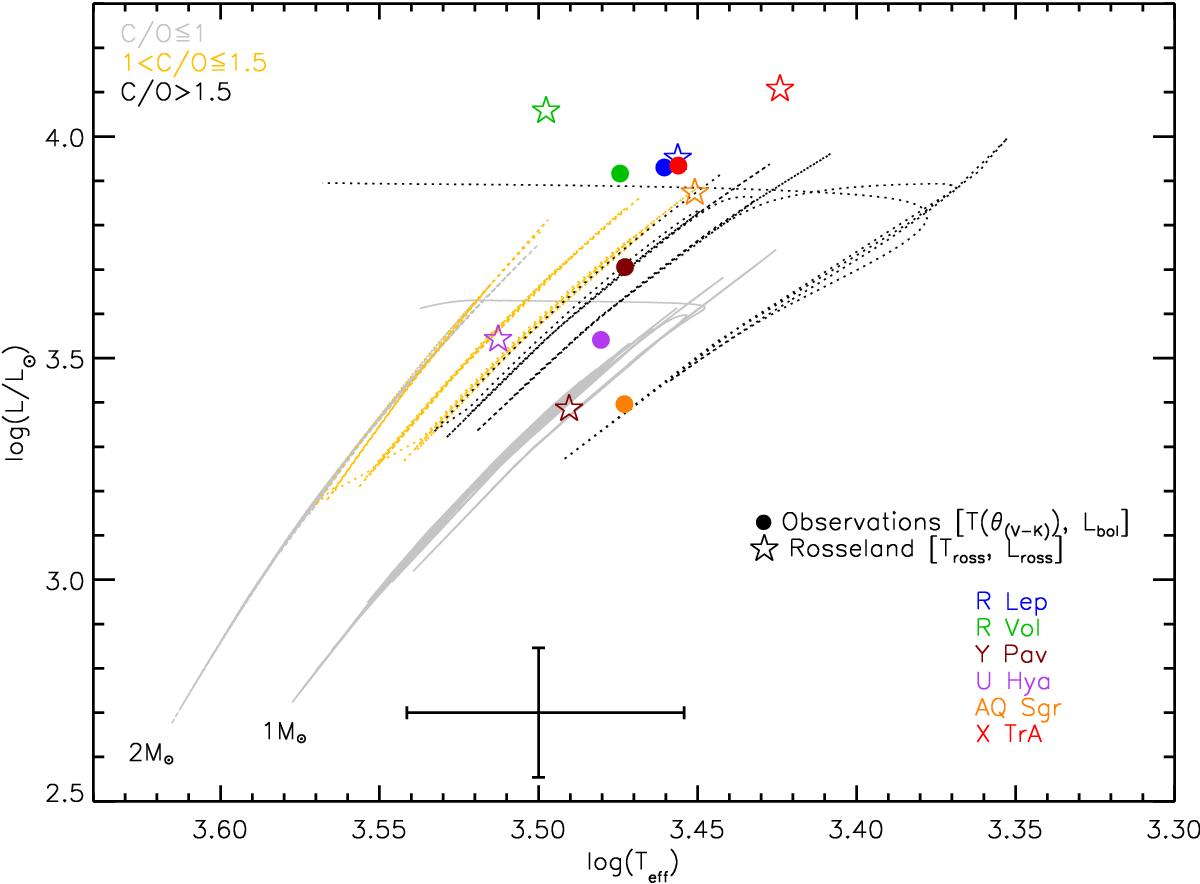
AGB region of the H-R diagram. The lines display solar metallicity evolutionary tracks from Marigo et al. (2013): gray lines mark the regions of Oxygen-rich stars with C/O < 1.0; yellow lines denote the region of C-rich stars with ![]() , while black lines mark stars with C/O > 1.5. The numbers indicate the mass values at the beginning of the thermal pulsing (TP)-AGB. For better visibility, the track with 2 M⊙ is plotted with a dotted line. Different symbols and colors refer to the luminosity and effective temperature, estimated through the comparison in this work of the models with spectro-photometric-interferometric-observations. A typical error-size bar is shown in the lower side of the figure.
, while black lines mark stars with C/O > 1.5. The numbers indicate the mass values at the beginning of the thermal pulsing (TP)-AGB. For better visibility, the track with 2 M⊙ is plotted with a dotted line. Different symbols and colors refer to the luminosity and effective temperature, estimated through the comparison in this work of the models with spectro-photometric-interferometric-observations. A typical error-size bar is shown in the lower side of the figure.
Current usage metrics show cumulative count of Article Views (full-text article views including HTML views, PDF and ePub downloads, according to the available data) and Abstracts Views on Vision4Press platform.
Data correspond to usage on the plateform after 2015. The current usage metrics is available 48-96 hours after online publication and is updated daily on week days.
Initial download of the metrics may take a while.