Fig. 11
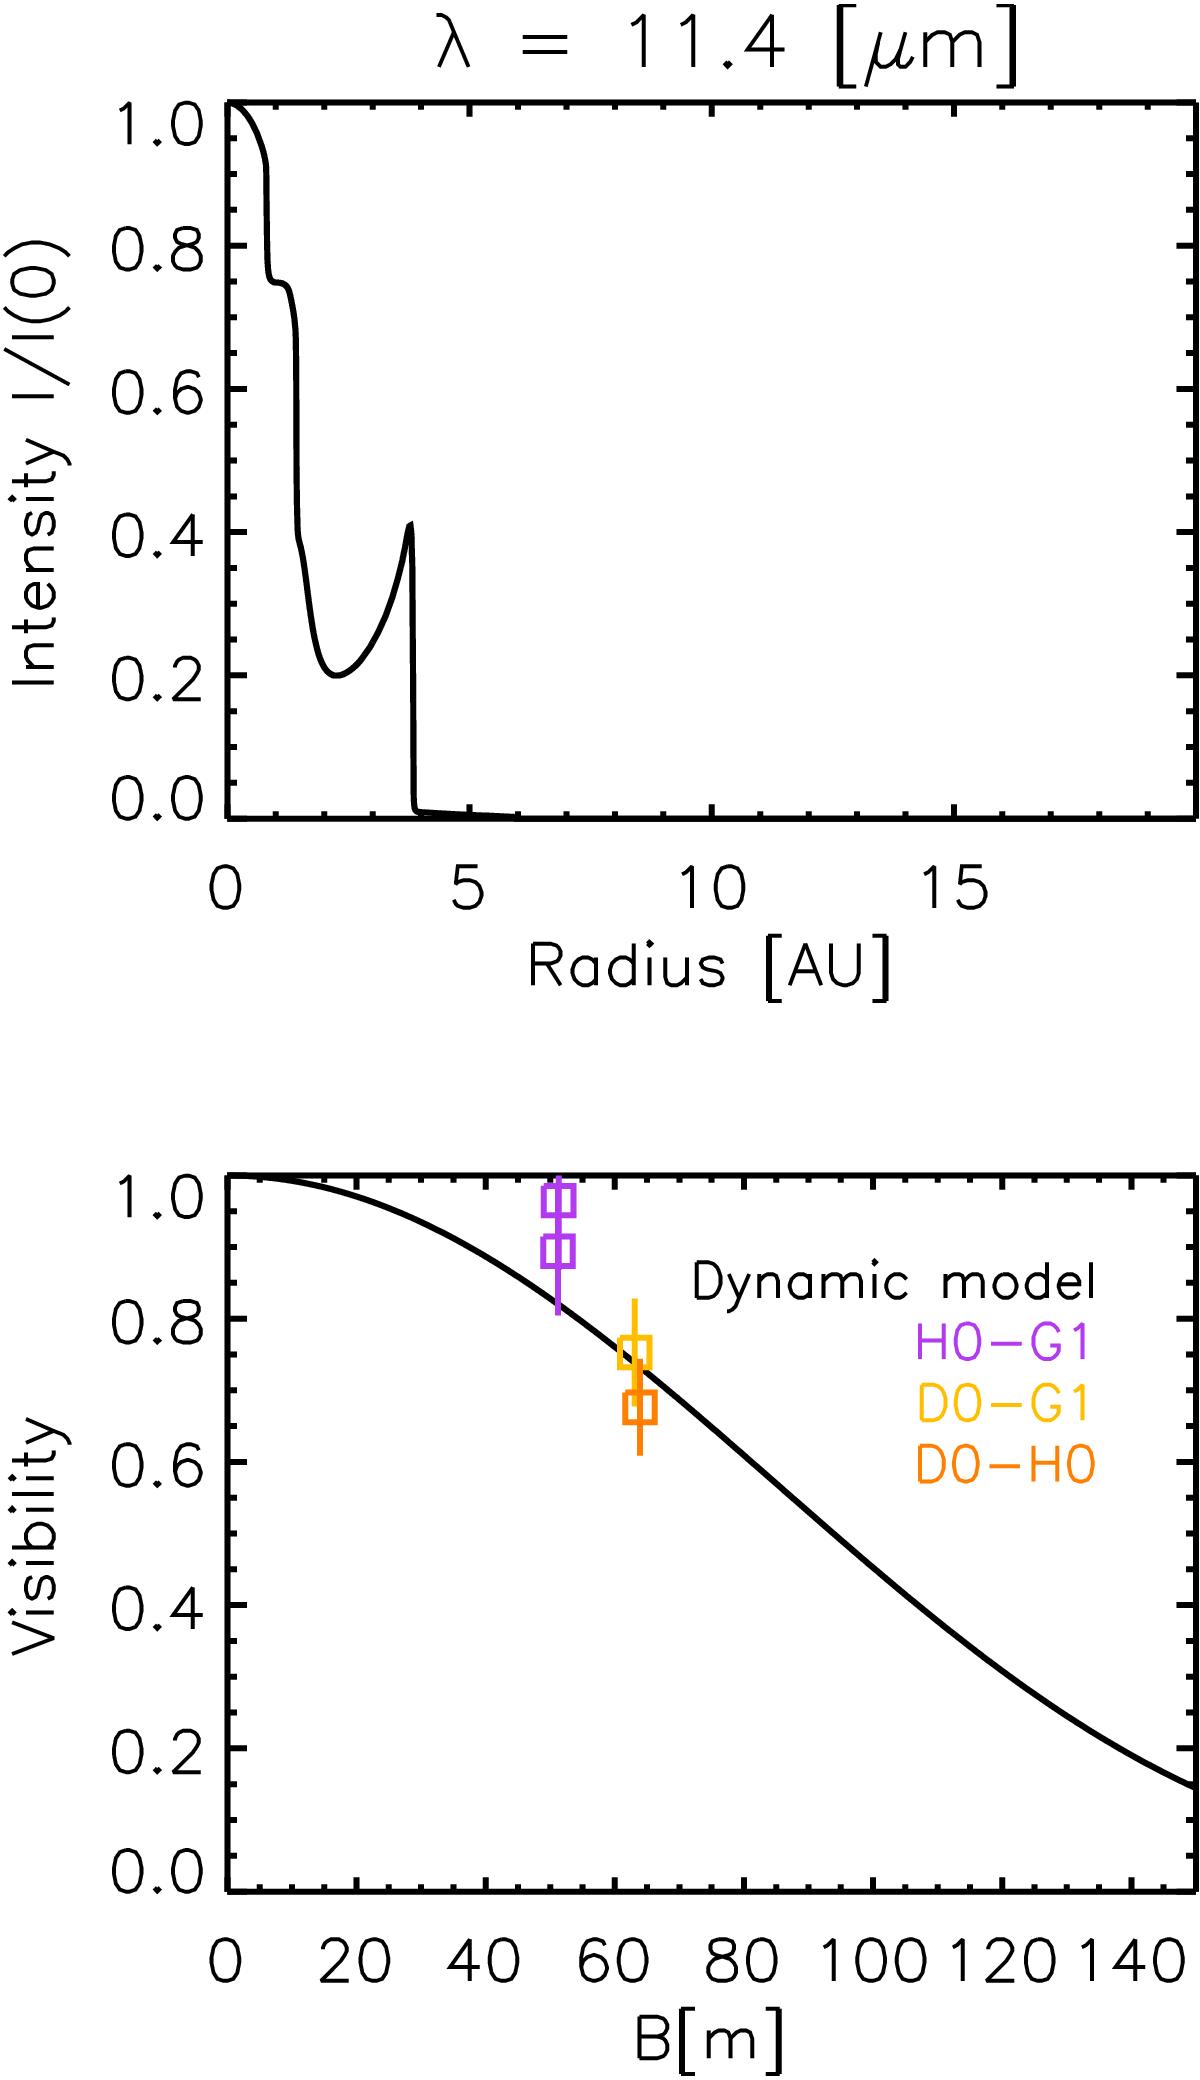
Interferometric observational MIDI data of Y Pav, in cases where the amount of SiC increased to 50% in the models, compared with the synthetic visibilities based on the DARWIN models; top: intensity profile at 11.3 μm and bottom: visibility vs. baseline. The black line shows the dynamic model, the colored symbols illustrate the MIDI measurements at different baseline configurations.
Current usage metrics show cumulative count of Article Views (full-text article views including HTML views, PDF and ePub downloads, according to the available data) and Abstracts Views on Vision4Press platform.
Data correspond to usage on the plateform after 2015. The current usage metrics is available 48-96 hours after online publication and is updated daily on week days.
Initial download of the metrics may take a while.