Fig. 9
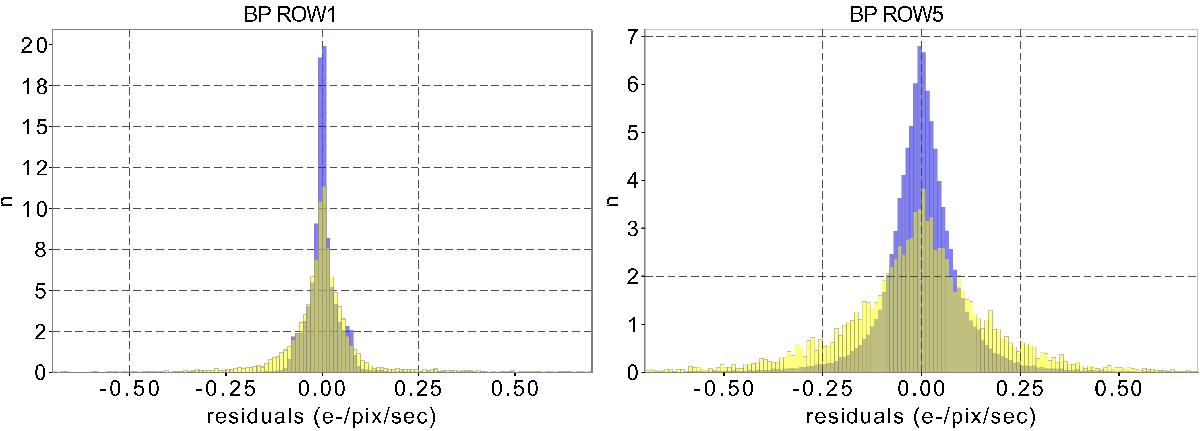
Residual distribution (normalised to the same area) for the stray light maps. In blue the data obtained from 1D transits, in yellow from 2D transits. The left plot shows the best case (for BP ROW1 with scatter ~0.031 for 1D data and ~0.057 for 2D data), while the right plot shows the worst case (for BP ROW5, with scatter ~0.075 for 1D data and ~0.161 for 2D data).
Current usage metrics show cumulative count of Article Views (full-text article views including HTML views, PDF and ePub downloads, according to the available data) and Abstracts Views on Vision4Press platform.
Data correspond to usage on the plateform after 2015. The current usage metrics is available 48-96 hours after online publication and is updated daily on week days.
Initial download of the metrics may take a while.