Fig. 27
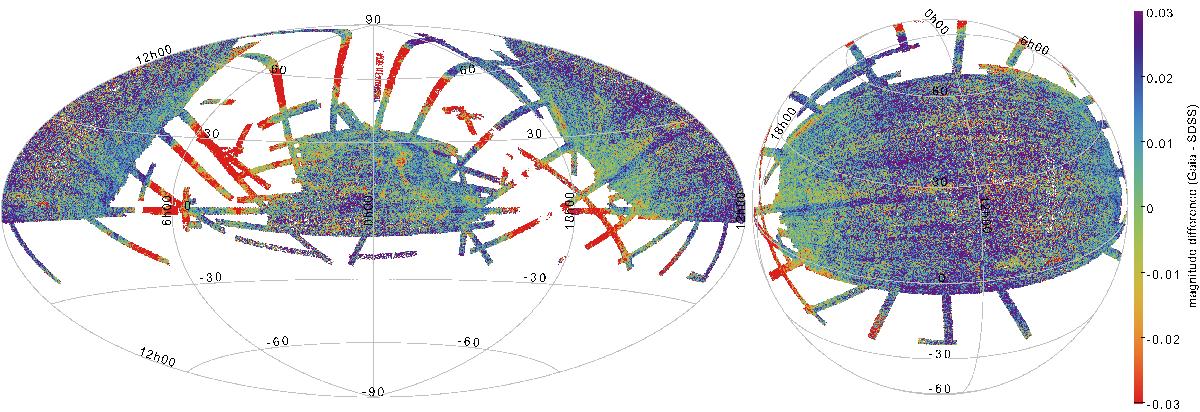
Sky distribution of the median zeropoint between the Gaia and SDSS photometric catalogues. The comparison is limited to sources fainter than G = 15 and to sources in the colour range 0.8 < g−r < 1.1. The empirical photometric transformations from van Leeuwen et al. (2017) have been used to estimate G magnitudes from g and r. The entire sky in equatorial coordinates is shown on the left, while the plot on the right shows a 3D view centred on the large area outside the Galactic plane covered by SDSS.

Current usage metrics show cumulative count of Article Views (full-text article views including HTML views, PDF and ePub downloads, according to the available data) and Abstracts Views on Vision4Press platform.
Data correspond to usage on the plateform after 2015. The current usage metrics is available 48-96 hours after online publication and is updated daily on week days.
Initial download of the metrics may take a while.