Free Access
Fig. 22
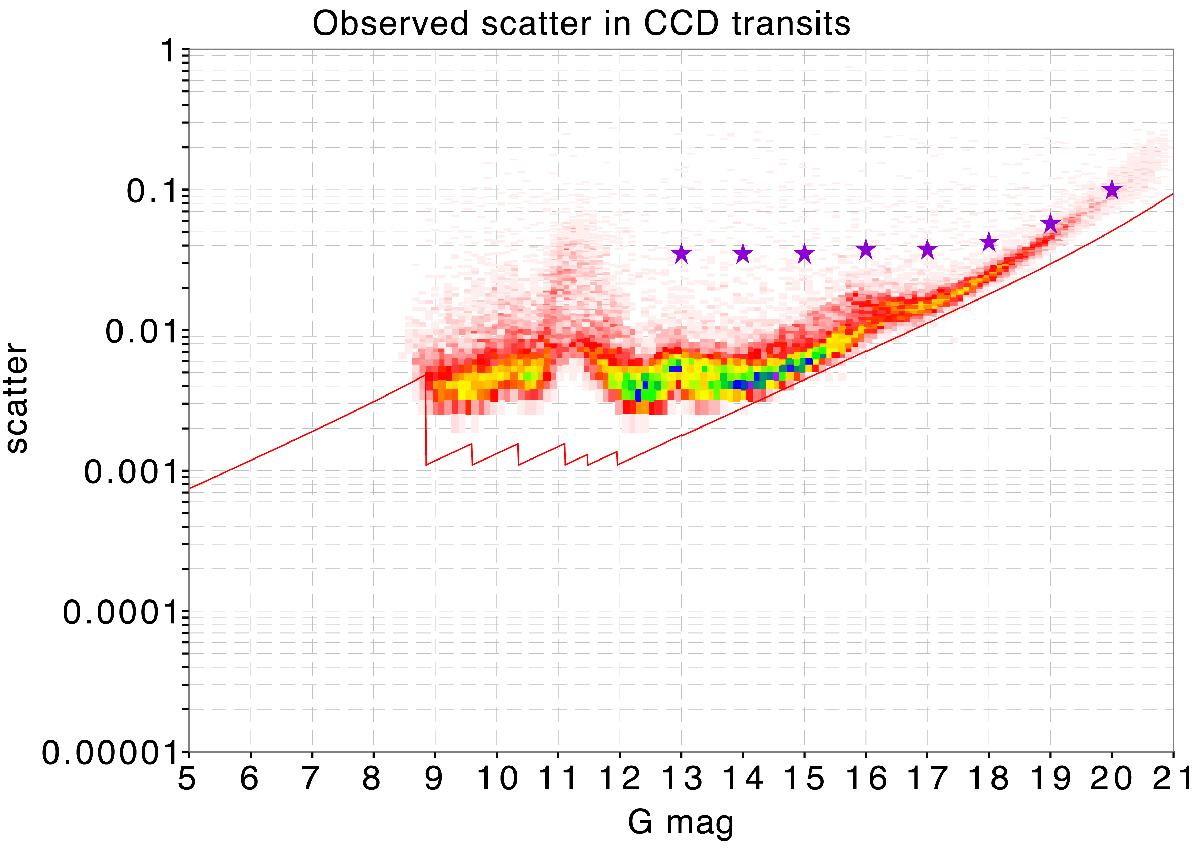
Measured scatter in G for sources in the most observed sky regions as a function of magnitude. The line shows the predicted accuracies using the formulation given in Jordi et al. (2010). The star symbols are the expected accuracies given on the Gaia scientific performance web page.
Current usage metrics show cumulative count of Article Views (full-text article views including HTML views, PDF and ePub downloads, according to the available data) and Abstracts Views on Vision4Press platform.
Data correspond to usage on the plateform after 2015. The current usage metrics is available 48-96 hours after online publication and is updated daily on week days.
Initial download of the metrics may take a while.