Fig. 20
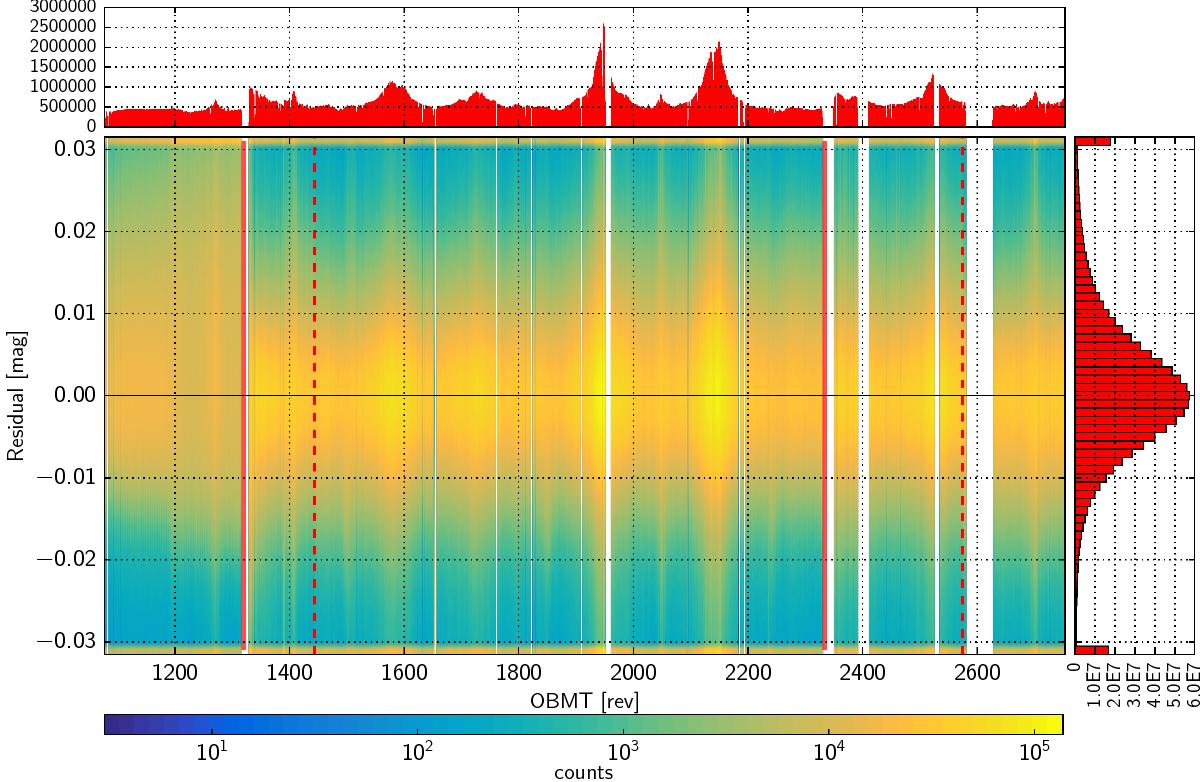
Distribution of photometric residuals in time for all data in AF1 CCDs and Window Class 1 (assigned to sources with magnitude in the range 13 < G < 16 as estimated on board). The time is given in OBMT revolutions (one revolution corresponds to approximately 6 h). Vertical solid red lines mark the occurrences of decontamination activities, while dashed lines correspond to refocus events.
Current usage metrics show cumulative count of Article Views (full-text article views including HTML views, PDF and ePub downloads, according to the available data) and Abstracts Views on Vision4Press platform.
Data correspond to usage on the plateform after 2015. The current usage metrics is available 48-96 hours after online publication and is updated daily on week days.
Initial download of the metrics may take a while.