Fig. 17
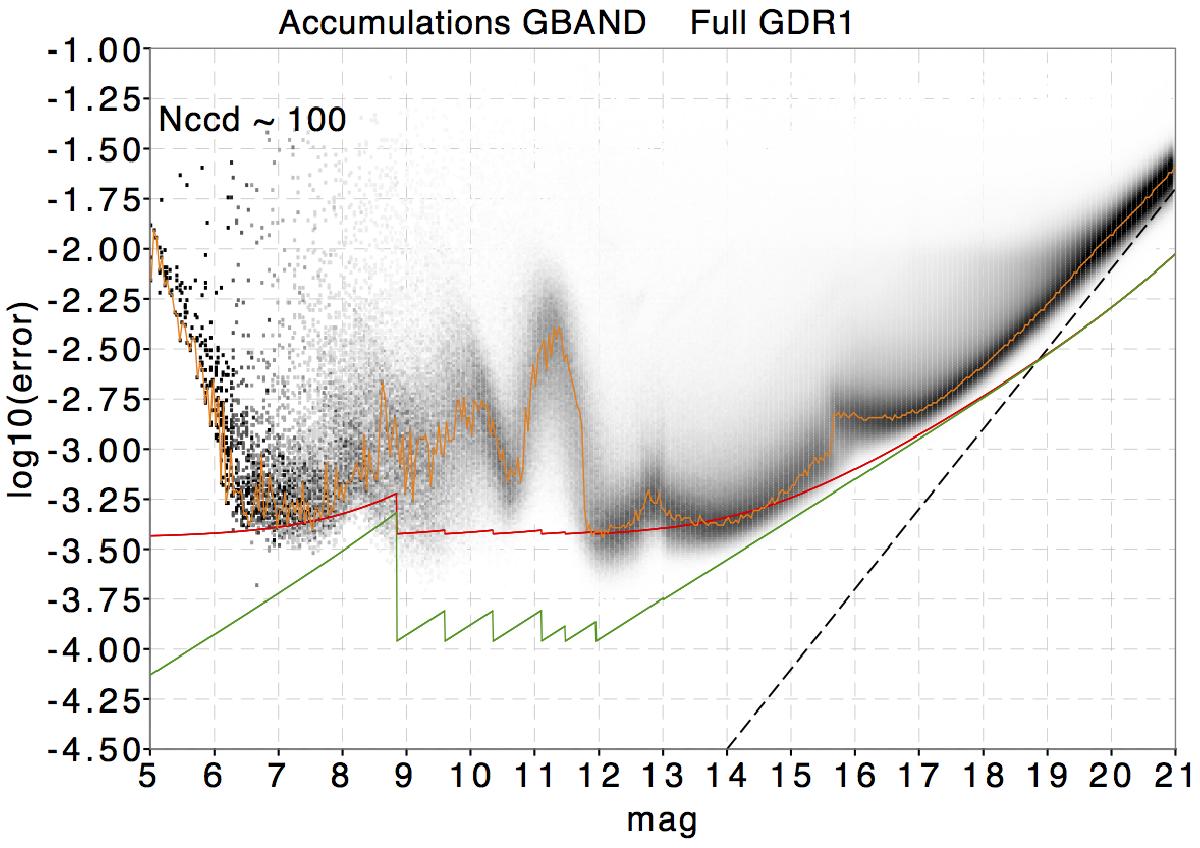
Distribution of error on the weighted mean G-value as a function of magnitude. The orange line shows the mode of the distribution. This plot is restricted to all sources with between 90 and 110 CCD transits. The green line shows the expected errors for sources with 100 CCD transits and for a nominal mission with perfect calibrations. The red line shows the same error function, but with a calibration error of 3 mmag added in quadrature to the individual observations. The dashed black line has a slope of 0.4 and indicates that the faint end is sky dominated. The distribution has been normalised along the magnitude axis, i.e. scaled so that each magnitude bin has the same number of sources in order to show features along the whole magnitude range. The greyscale is linear.
Current usage metrics show cumulative count of Article Views (full-text article views including HTML views, PDF and ePub downloads, according to the available data) and Abstracts Views on Vision4Press platform.
Data correspond to usage on the plateform after 2015. The current usage metrics is available 48-96 hours after online publication and is updated daily on week days.
Initial download of the metrics may take a while.