Fig. 14
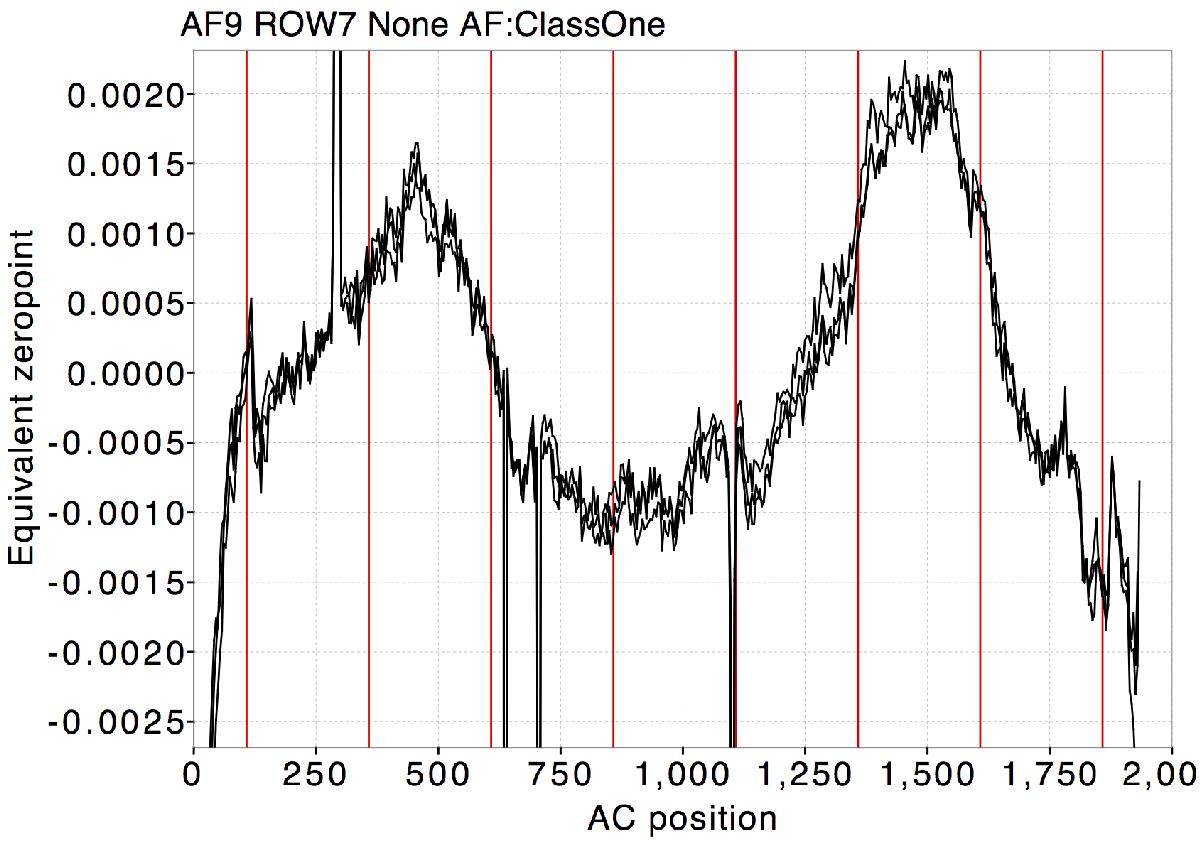
Zeropoint of the small-scale sensitivity calibrations as a function of across-scan position on the CCD (same calibration configuration as Fig. 11) where the time range of Gaia DR1 has been divided giving three sets of calibrations. We note the change in the ordinate scale. This plot was derived from a preparatory processing run (OR5S3).
Current usage metrics show cumulative count of Article Views (full-text article views including HTML views, PDF and ePub downloads, according to the available data) and Abstracts Views on Vision4Press platform.
Data correspond to usage on the plateform after 2015. The current usage metrics is available 48-96 hours after online publication and is updated daily on week days.
Initial download of the metrics may take a while.