Fig. 13
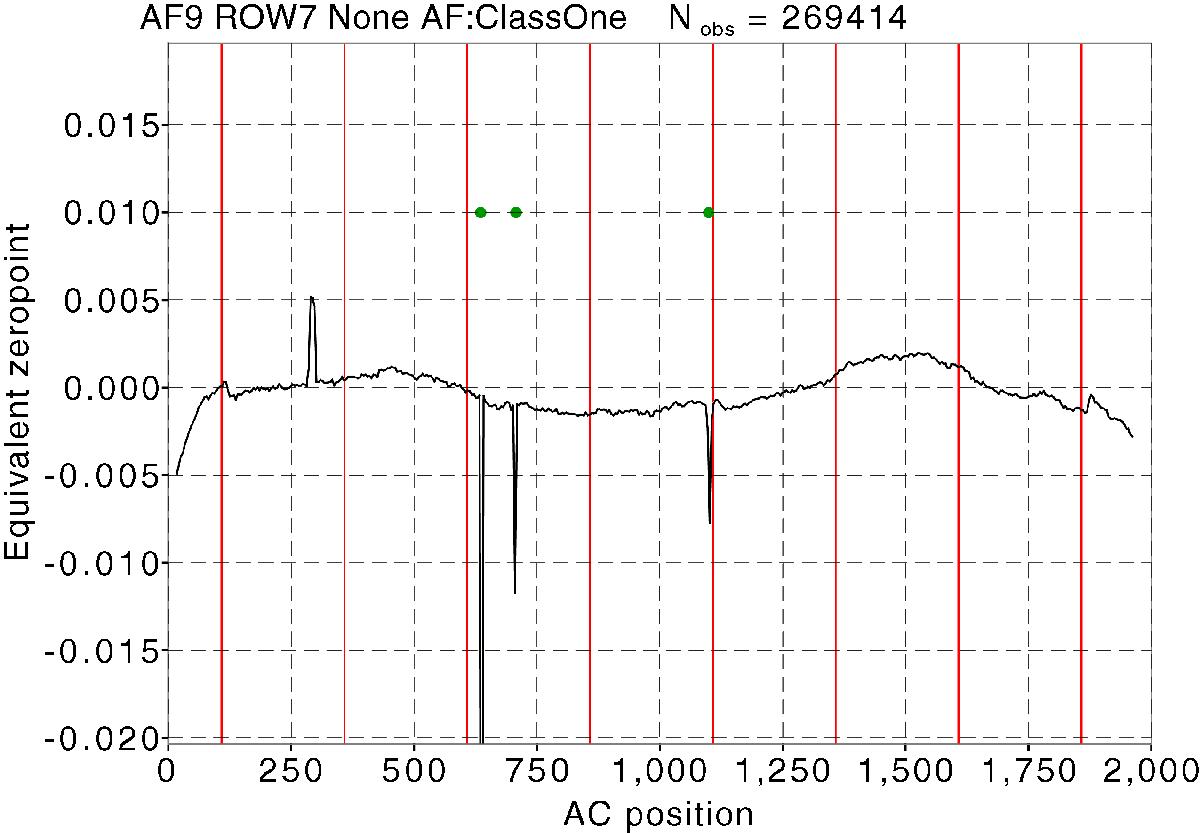
Zeropoint of the small-scale sensitivity calibration as a function of across-scan position on the CCD for an example calibration unit. As defined in Carrasco et al. (2016), 1.0 has been subtracted from the zeropoint. The calibration unit is the same as in Fig. 11. The red lines show the locations of the CCD stitch blocks and the green dots show the location of detected bad columns.
Current usage metrics show cumulative count of Article Views (full-text article views including HTML views, PDF and ePub downloads, according to the available data) and Abstracts Views on Vision4Press platform.
Data correspond to usage on the plateform after 2015. The current usage metrics is available 48-96 hours after online publication and is updated daily on week days.
Initial download of the metrics may take a while.