Fig. 4
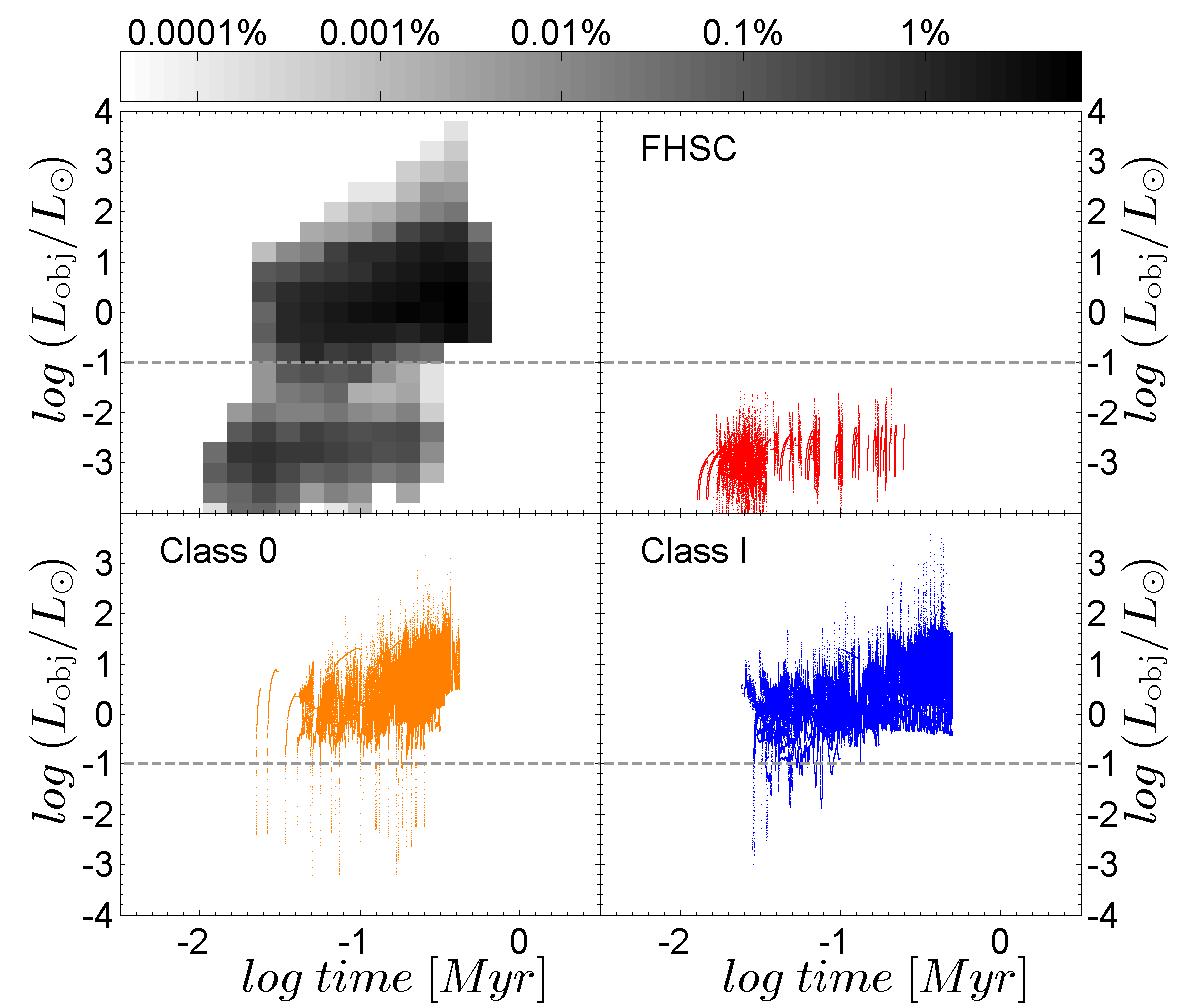
Total luminosity (Lobj) vs. evolutionary time (tevol) diagram. The time is counted from the onset of core collapse. The horizontal dashed lines mark the maximum VeLLO luminosity of 0.1 L⊙. The gray-scale mosaic presents the fraction of total time (in per cent) that all models spend in various bins in the Lobj–tevol diagram. The corresponding scale bar shows this fraction in per cent. The red, orange, and blue dots present the model data for the FHSC, Class 0 and Class I phases, respectively.
Current usage metrics show cumulative count of Article Views (full-text article views including HTML views, PDF and ePub downloads, according to the available data) and Abstracts Views on Vision4Press platform.
Data correspond to usage on the plateform after 2015. The current usage metrics is available 48-96 hours after online publication and is updated daily on week days.
Initial download of the metrics may take a while.