Fig. 1
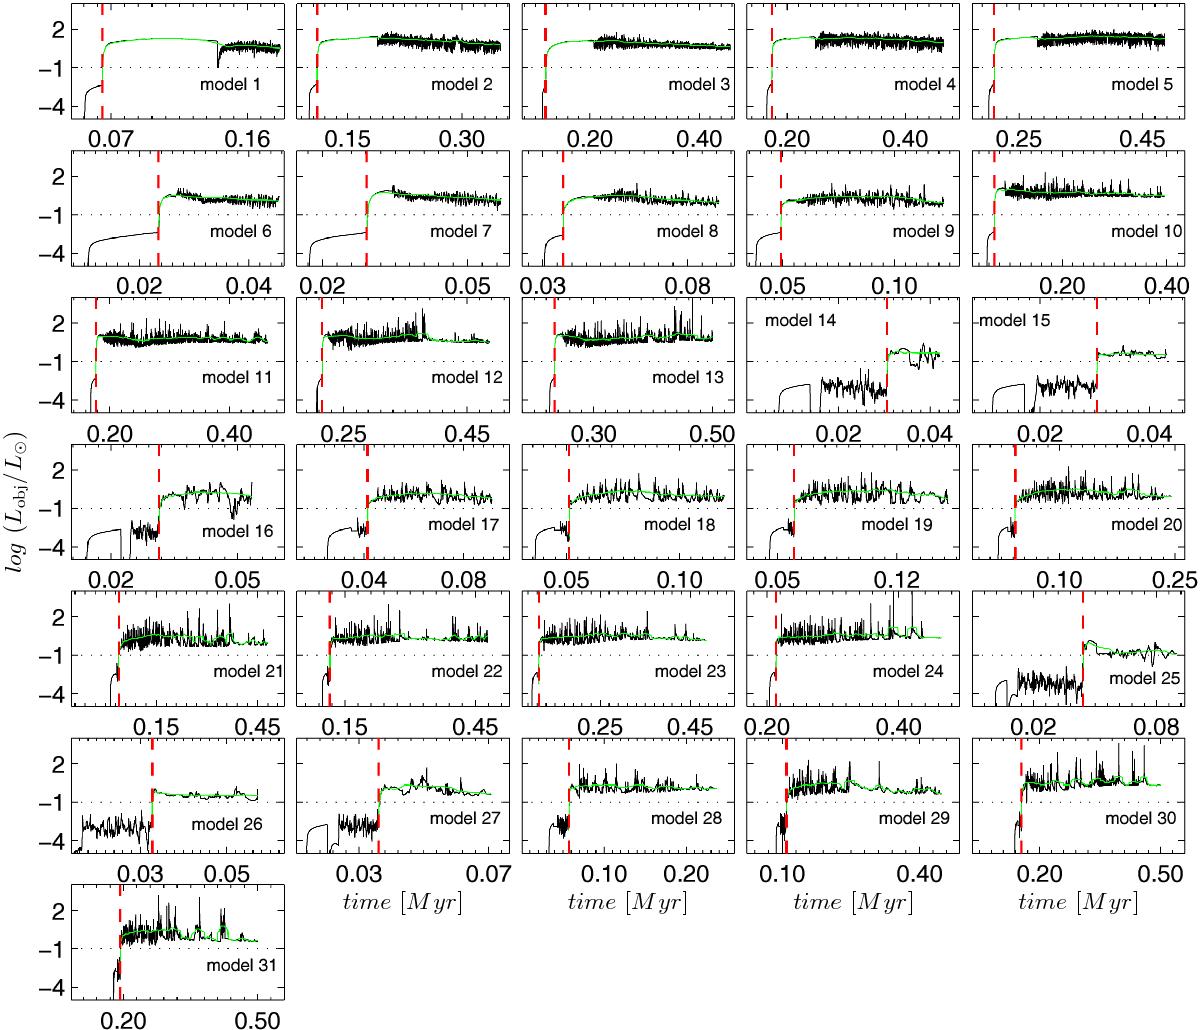
Total luminosity of the central object vs. time elapsed since the onset of core collapse in 31 models with the hybrid accretion scenario (black solid lines). The horizontal dotted lines indicate the upper luminosity for VeLLOs. The vertical dashed lines mark the instance of protostar formation. The green solid lines present the total stellar luminosity averaged over a time period of 20 kyr for models 21–24 and 29–31 and over a time period of 5 kyr for the remaining models.
Current usage metrics show cumulative count of Article Views (full-text article views including HTML views, PDF and ePub downloads, according to the available data) and Abstracts Views on Vision4Press platform.
Data correspond to usage on the plateform after 2015. The current usage metrics is available 48-96 hours after online publication and is updated daily on week days.
Initial download of the metrics may take a while.