Free Access
Fig. 15
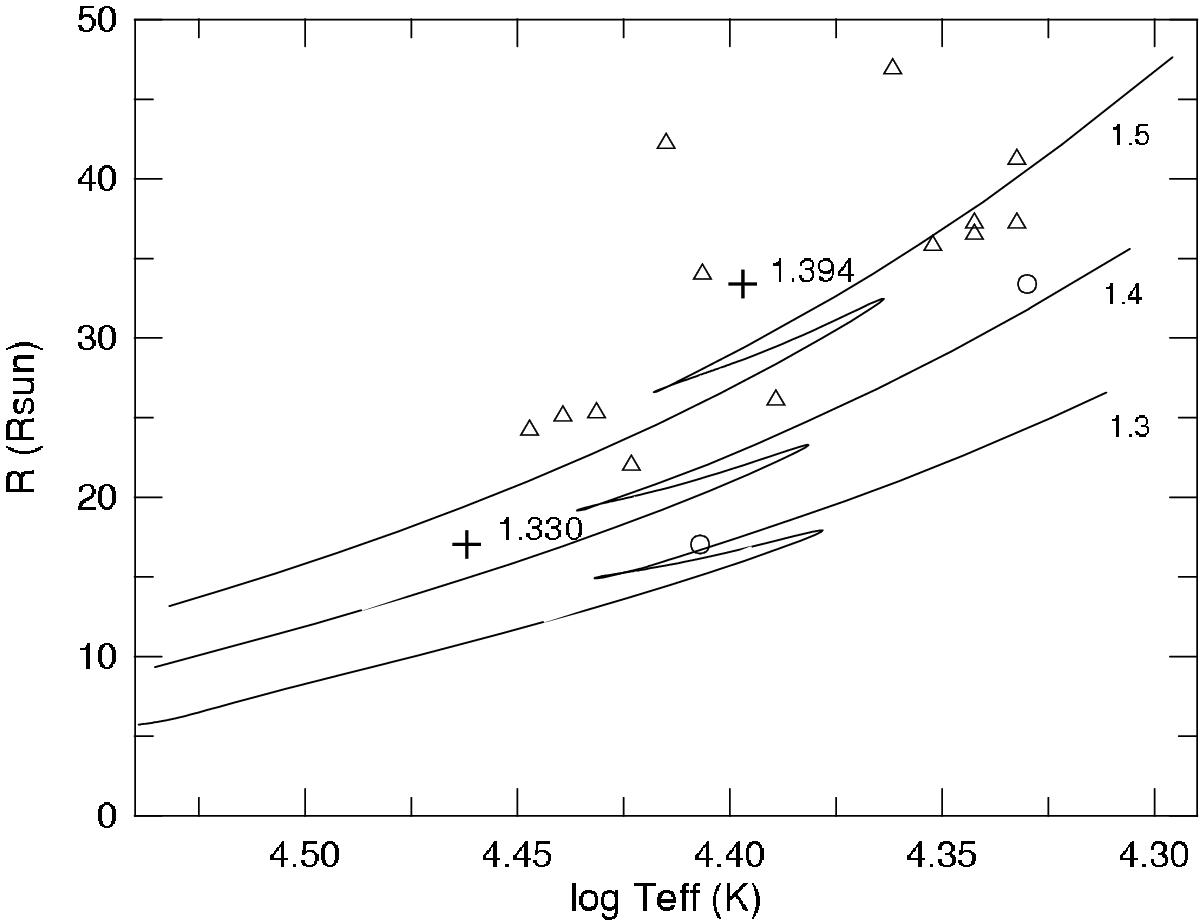
HD 318015: the lines show the relation between log Teff and R for the evolutionary models published by Claret (2004). The lines are labelled by log M. Two plus symbols are the positions of both binary components, also labelled by log M. Two circles show where the stars with the given masses and radii should be located.
Current usage metrics show cumulative count of Article Views (full-text article views including HTML views, PDF and ePub downloads, according to the available data) and Abstracts Views on Vision4Press platform.
Data correspond to usage on the plateform after 2015. The current usage metrics is available 48-96 hours after online publication and is updated daily on week days.
Initial download of the metrics may take a while.